| |
Temperature Effects of Point Sources, Riparian Shading, and Dam
Operations on the Willamette River
Analysis of Model Results

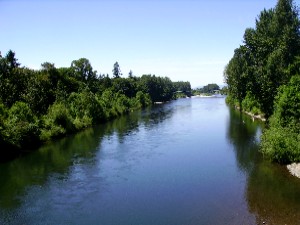
McKenzie River at Coberg, OR
(Photo by G. Hess, 19-Jun-2007)
|
Model results were analyzed using the same general method used by the Oregon
Department of Environmental Quality (ODEQ) in the development of the
Willamette
temperature TMDL. That method may be summarized as follows:
- Determine the 7-day moving average of the daily maximum (7dADM) water
temperature for every model segment and every day simulated in each
model run. Flow-weighted daily maximum temperatures were used for
the upper and middle Willamette River models. Volume-weighted
daily maximum temperatures were used for the lower Willamette
River model. Surface daily maximum temperatures were used for all
other submodels.
- Subtract the 7dADM temperatures for the baseline
model run from the 7dADM temperatures for the target model run
for every model segment and every simulated day. The result is
a distribution of 7dADM temperature differences at each location
in the model. The baseline run typically was the Natural Thermal
Potential, or NTP, run.
- Determine the 95th percentile of the 7dADM temperature differences at
each location. In the calculation of the 95th percentile, data
points were included from a particular location and time only if
they adhered to two criteria. If either is not met, then the data
point is excluded from the analysis. Those criteria are:
- The 7dADM temperature from the NTP run at that time exceeds the
numeric criteria of the temperature standard at some point downstream.
- The modeled daily average flow at the appropriate point of maximum
impact (POMI) is equal to or greater than the post-dam
7Q10 low-flow statistic at that location. The
POMI is the location of a cumulative point-source heating maximum
determined on the basis of model results. POMI locations are at
or near Albany in the upper Willamette River model, in the Newberg
pool or at Salem in the middle Willamette River model, and in
the Portland Harbor for the lower Willamette River model. Local
POMIs were used for the Coast Fork and McKenzie River models.
7Q10 flow values were obtained from the
Willamette
temperature TMDL document (Oregon Department
of Environmental Quality, 2006b).
This analysis method was discussed with ODEQ staff prior to its use,
and it was agreed that this method was very similar, if not identical,
to the method used by ODEQ to analyze model results for the TMDL.
Note that at least six different common methods can be used to compute
percentiles, and no good agreement exists as to which is preferred. The SAS
statistics package alone offers five separate methods for calculating
percentiles (SAS Institute, 1990). ODEQ staff
relied on Microsoft© Excel to compute percentiles, and Excel's method,
though related, does not match any of those offered by SAS. Most of these
percentile methods differ in their assumptions for the intervals that
surround each ranked data point; as a result, the computations differ
most when applied at the extremes of the distribution, such as at the
5th or 95th percentile. In the USGS analysis, the method documented by
Helsel and Hirsch (2002) and identical to SAS
Proc Univariate's definition 4 was used to compute the 95th percentiles.
This method is widely applied, but may result in slightly higher 95th
percentiles with some datasets, as compared to those computed by Excel.
|