Background |
Objectives & Approach |
Significant Findings
Selected Results |
Model |
W2 Modifications |
Downloads |
Project Home
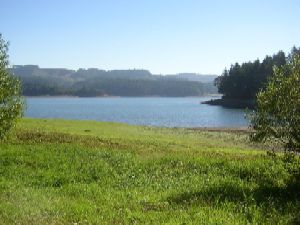 Henry Hagg Lake near Sain Creek (Photo by S. Rounds, 22-Sep-2004) |
Once the USGS water-quality model of Hagg Lake was constructed and calibrated, it was used to predict the changes in circulation, temperature, and quality that might result from a suite of potential dam modifications. Thirty-six model scenarios were run, using various combinations of dam raises, outlet configurations, methods for supplementing lake inflows, and downstream release schedules. Most of the model scenarios were run using the hydrologic and meteorologic conditions from 2002, which was a typical year. Several of the scenarios also were run while imposing conditions from 2001, a drought year. Model scenarios were run for an entire calendar year so that seasonal temperature and water-quality variations and the efficacy of inflow and release schedules could be examined over their entire range.
The details of each of the scenarios and the results of this investigation are documented in USGS Scientific Investigations Report 2006-5060:
Sullivan, A.B. and Rounds, S.A., 2006, Modeling water-quality
effects of structural and operational changes to Scoggins Dam and Henry Hagg Lake,
Oregon: U.S. Geological Survey Scientific Investigations Report 2006-5060, 36 p.
[Available online at
http://pubs.usgs.gov/sir/2006/5060/]
One of the more useful and interesting ways to visualize model output is by viewing a time-indexed color plot of vertical profiles. In this type of plot, a vertical profile of temperature or the concentration of some simulated substance is shown as a function of time and elevation, with the temperature or substance concentration represented by a color. The plot below is an example of such a visualization for temperature for the 2002 calibrated conditions.
Time in these plots is always on the X axis, with January 1st on the left and December 31st on the right. Elevation is on the Y axis. Note how this plot includes how the water-surface elevation of the lake changes over the course of the year -- highest in May and lowest in October or November due to summertime releases for downstream users. The heavy black line running across the figure indicates the level of the lake's outlet; some plots will have more than one line because some scenarios used more than one lake outlet. Finally, the temperature at each elevation and date is plotted according to the color scale shown at the bottom of the plot; in this case, deep blue is cold water and dark red is warm water. This information is valid only for a specific location in the lake -- all of these vertical profiles are taken from the deepest part of the lake near the dam. Fortunately, water-quality variations in the lake are strongest along the vertical dimension, so this representation, though taken from the deepest part of the lake near the dam, is fairly valid as a representation of conditions in most of the lake.
Thirty six model scenarios were run, and these time-indexed color plots of vertical profiles are available here for each model run for temperature, dissolved oxygen, ammonia, and chlorophyll. You may download the entire set of plots [ZIP, 2.44 Mb], or view the individual PNG images through the links in the table below. For the details of each model scenario, see the report.
| Year | Scenario Number |
Water Deliveries |
Dam Raise (feet) |
Outlet Types | Inflow Augmentation |
Plots |
|---|---|---|---|---|---|---|
| 2002 | 0 (base) | measured | 0 | original | none | WT | DO | Chla | NH3 |
| 1a | initial | 20 | original | none | WT | DO | Chla | NH3 | |
| 1b | maximum | 20 | original | none | WT | DO | Chla | NH3 | |
| 2a | initial | 20 | original plus variable | none | WT | DO | Chla | NH3 | |
| 2b | maximum | 20 | original plus variable | none | WT | DO | Chla | NH3 | |
| 3a | initial | 20 | original plus fixed | none | WT | DO | Chla | NH3 | |
| 3b | maximum | 20 | original plus fixed | none | WT | DO | Chla | NH3 | |
| 4a | initial | 20 | variable only | none | WT | DO | Chla | NH3 | |
| 4b | maximum | 20 | variable only | none | WT | DO | Chla | NH3 | |
| 5a | initial | 40 | original | none | WT | DO | Chla | NH3 | |
| 5b | maximum | 40 | original | none | WT | DO | Chla | NH3 | |
| 6a | initial | 40 | original plus variable | none | WT | DO | Chla | NH3 | |
| 6b | maximum | 40 | original plus variable | none | WT | DO | Chla | NH3 | |
| 7a | initial | 40 | original plus fixed | none | WT | DO | Chla | NH3 | |
| 7b | maximum | 40 | original plus fixed | none | WT | DO | Chla | NH3 | |
| 8a | initial | 40 | variable only | none | WT | DO | Chla | NH3 | |
| 8b | maximum | 40 | variable only | none | WT | DO | Chla | NH3 | |
| 9a | initial | 40 | original | Sain Ck Tunnel, low inflows | WT | DO | Chla | NH3 | |
| 9b | maximum | 40 | original | Sain Ck Tunnel, low inflows | WT | DO | Chla | NH3 | |
| 10a | initial | 40 | original | Sain Ck Tunnel, high inflows | WT | DO | Chla | NH3 | |
| 10b | maximum | 40 | original | Sain Ck Tunnel, high inflows | WT | DO | Chla | NH3 | |
| 11a | initial | 40 | original plus variable | Sain Ck Tunnel, high inflows | WT | DO | Chla | NH3 | |
| 11b | maximum | 40 | original plus variable | Sain Ck Tunnel, high inflows | WT | DO | Chla | NH3 | |
| 12a | initial | 40 | original plus fixed | Sain Ck Tunnel, high inflows | WT | DO | Chla | NH3 | |
| 12b | maximum | 40 | original plus fixed | Sain Ck Tunnel, high inflows | WT | DO | Chla | NH3 | |
| 13a | initial | 40 | variable only | Sain Ck Tunnel, high inflows | WT | DO | Chla | NH3 | |
| 13b | maximum | 40 | variable only | Sain Ck Tunnel, high inflows | WT | DO | Chla | NH3 | |
| 14a | initial | 40 | original plus variable | Pump-back | WT | DO | Chla | NH3 | |
| 14b | maximum | 40 | original plus variable | Pump-back | WT | DO | Chla | NH3 | |
| 15a | initial | 25 | original plus variable | Pump-back | WT | DO | Chla | NH3 | |
| 15b | maximum | 25 | original plus variable | Pump-back | WT | DO | Chla | NH3 | |
| 2001 | 0 (base) | measured | 0 | original | none | WT | DO | Chla | NH3 |
| 14a | initial | 40 | original plus variable | Pump-back | WT | DO | Chla | NH3 | |
| 14b | maximum | 40 | original plus variable | Pump-back | WT | DO | Chla | NH3 | |
| 15a | initial | 25 | original plus variable | Pump-back | WT | DO | Chla | NH3 | |
| 15b | maximum | 25 | original plus variable | Pump-back | WT | DO | Chla | NH3 |
The model source code and the compiled executable used in these scenarios is available for download [ZIP, 779 Kb]. The model was compiled to run on the Windows operating system, but can be compiled and run on any system that has a FORTRAN 95 compiler. Although CE-QUAL-W2 is available with a graphical user interface, the copy distributed here is a generic version that does not include the interface. The generic version produces the same results, but simply provides less feedback to the model user during the run. The generic version of the model was used exclusively by USGS personnel in this investigation.
The USGS model was a modification of version 3.12 (dated 15-Aug-2003)
of the CE-QUAL-W2 source code. Modifications included the addition of a
zooplankton group, a new subroutine
for the blending of withdrawals to meet downstream temperature targets,
and several updates to correct coding bugs, as documented on the
CE-QUAL-W2 website. The model was
compiled using the Compaq Visual Fortran compiler (version 6.6.A) with
the following options:
  /fast /nodebug /real_size:64
  /warn:(argument_checking,nofileopt,unused,nousage)
In particular, the "/real_size:64" option was important in avoiding memory alignment problems.
For these model scenarios, the USGS modeling team added a new subroutine to CE-QUAL-W2 to allow the model to blend water from multiple outlets, and adjust the elevation of a variable-elevation outlet, in an attempt to meet a user-specified downstream temperature target. This new subroutine was not present (and was not needed) in the model code used in the first phase of this study, in which the model of Hagg Lake was constructed and calibrated. The new subroutine is documented in the model scenario report cited above and also in the following paper:
Rounds, S.A. and Sullivan, A.B., 2006, Development and
use of new routines in CE-QUAL-W2 to blend water from multiple reservoir
outlets to meet downstream temperature targets, in Proceedings of
the Third Federal Interagency Hydrologic Modeling Conference, April 2-6,
2006, Reno, NV: Subcommittee on Hydrology of the Interagency Advisory
Committee on Water Information, ISBN 0-9779007-0-3.
(full text
[PDF, 198 Kbytes])
Questions? Comments? For more information about this project, contact:
Stewart Rounds
U.S. Geological Survey
2130 SW 5th Avenue
Portland, OR 97201
503-251-3280
sarounds@usgs.gov
Oregon Water Science Center Home page
Oregon Water Science Center Hydrologic Studies page
Tualatin Water Quality Assessment page
Henry Hagg Lake Water Quality Model page
![]() U.S. Department of the Interior |
U.S. Geological Survey
U.S. Department of the Interior |
U.S. Geological Survey
URL: https://or.water.usgs.gov/tualatin/hagg_lake/scenarios/index.html
Page Contact Information: Stewart Rounds
Page Last Modified: Sunday - Jan 13, 2013 at 20:24:19 EST
