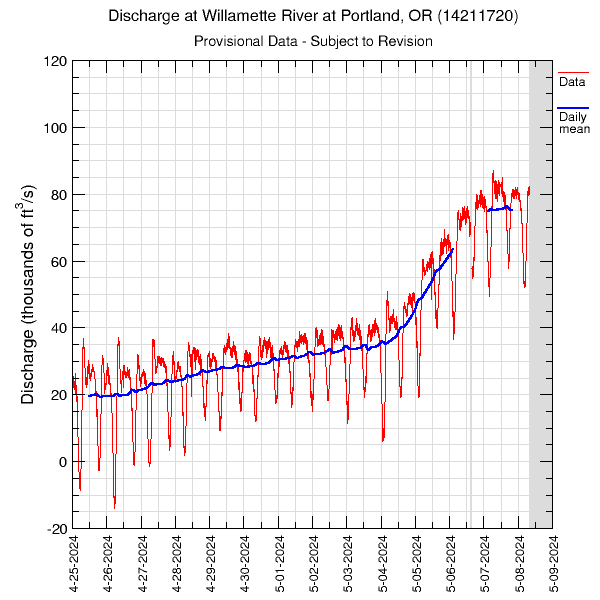
14-Days of Data at the Willamette River at Portland, OR (14211720)Data are downloaded and processed every 3 hours. The Willamette River at Portland site is located at the Morrison Bridge in downtown Portland, OR. Data are collected every half hour. Periods with no data are plotted as grey areas. These data are provisional and are subject to revision. DischargeValues less than 20,000 ft3/s are estimates only. Graph updated: Tuesday, 30-Jun-2026 13:59:30 EDT
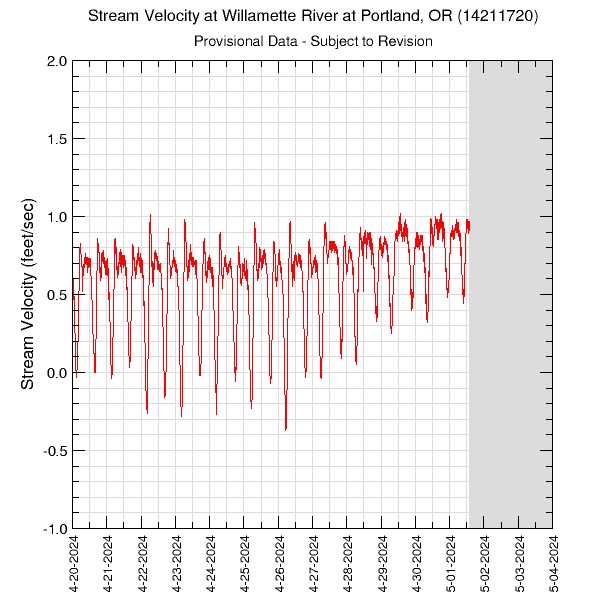
Stream VelocityValues near zero are estimates only. Graph updated: Tuesday, 30-Jun-2026 13:59:38 EDT
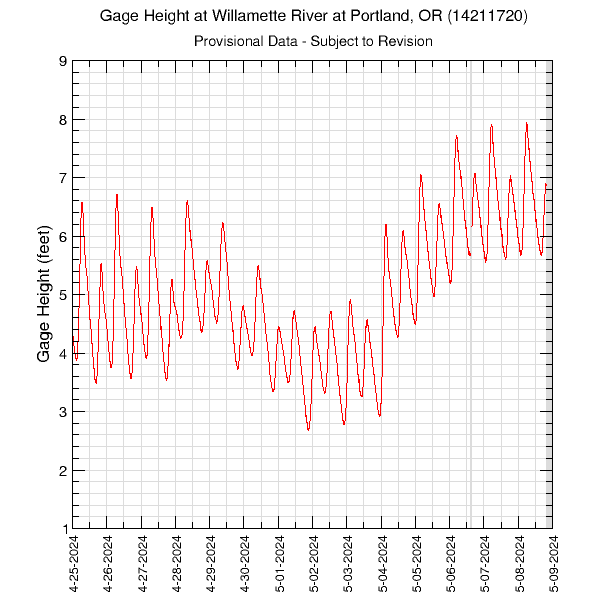
Gage HeightGraph updated: Tuesday, 30-Jun-2026 13:59:29 EDT
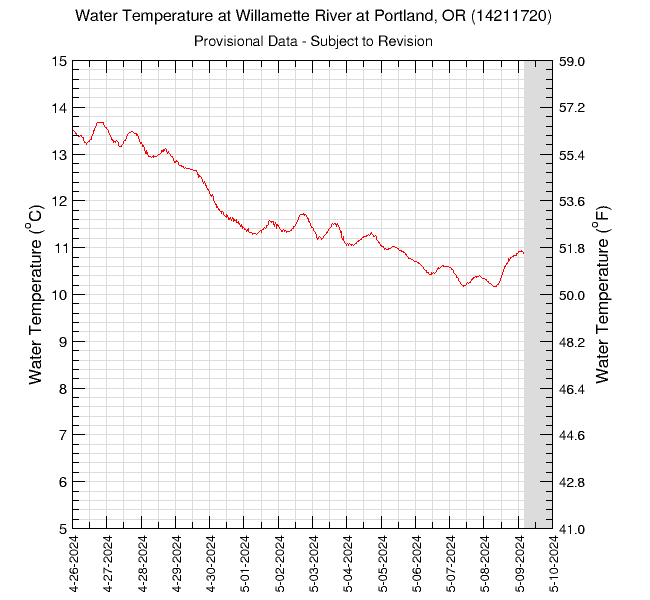
Water TemperatureGraph updated: Tuesday - Jun 30, 2026 at 13:59:35 EDT
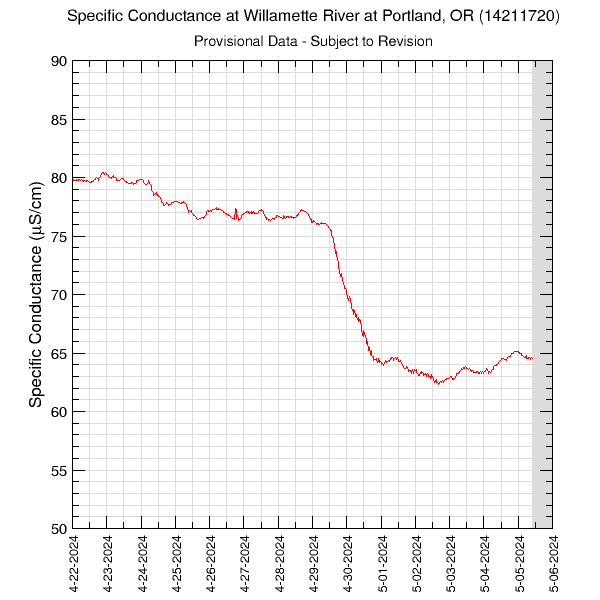
Specific ConductanceGraph updated: Tuesday - Jun 30, 2026 at 13:59:25 EDT
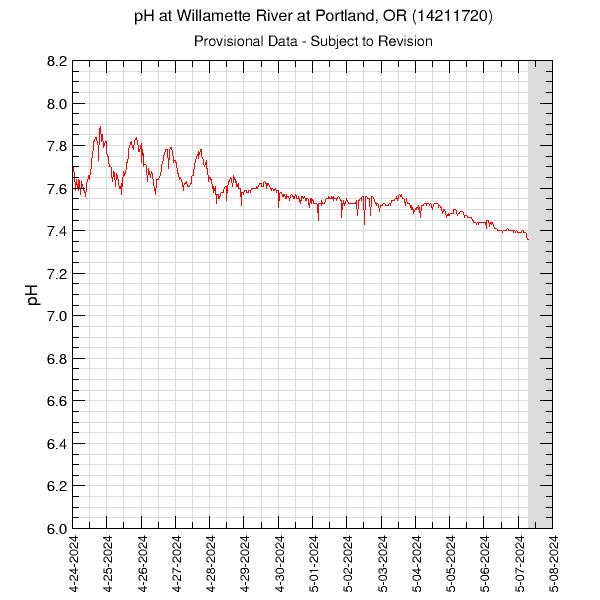
pHGraph updated: Tuesday - Jun 30, 2026 at 13:59:32 EDT
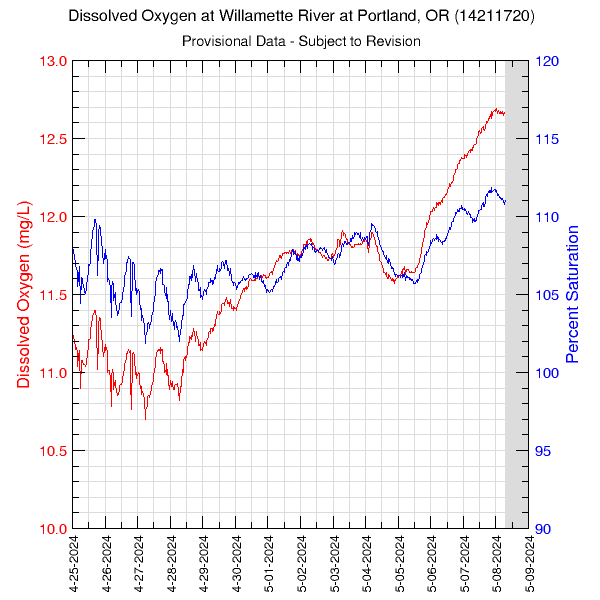
Dissolved OxygenData in the graph are plotted against the axis of the same color. Percent saturation is estimated as a function of water temperature and barometric pressure at this site. Graph updated: Tuesday - Jun 30, 2026 at 13:59:26 EDT
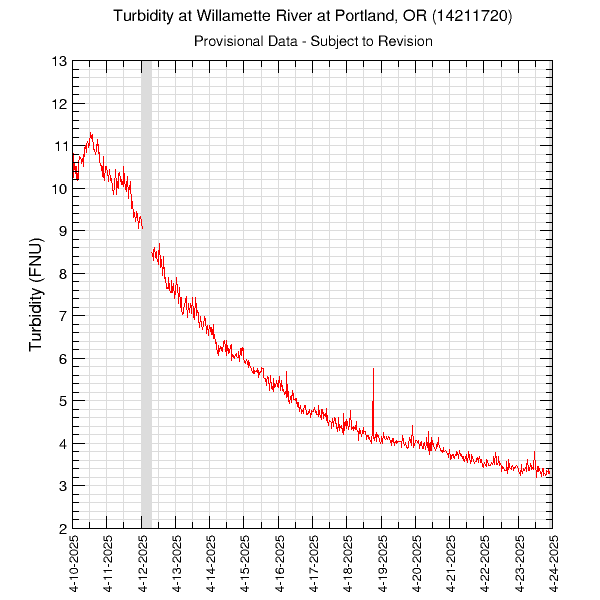
TurbidityTurbidity data are measured in FNU units. Graph updated: Tuesday - Jun 30, 2026 at 13:59:36 EDT
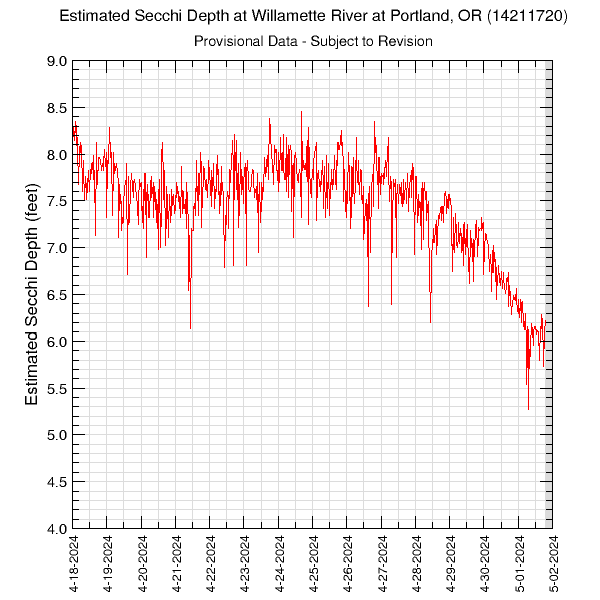
Estimated Secchi DepthSecchi depth data are estimated based on turbidity data and are measured in feet. Graph updated: Tuesday - Jun 30, 2026 at 13:59:34 EDT
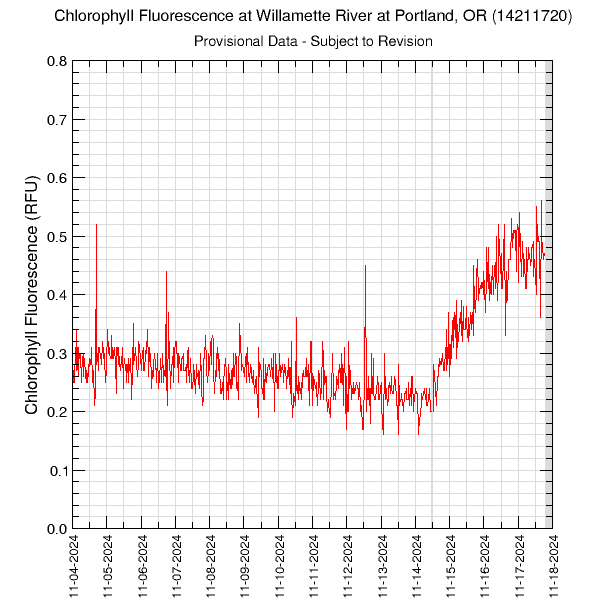
Chlorophyll Fluorescence (RFU)Graph updated: Tuesday - Jun 30, 2026 at 13:59:27 EDT
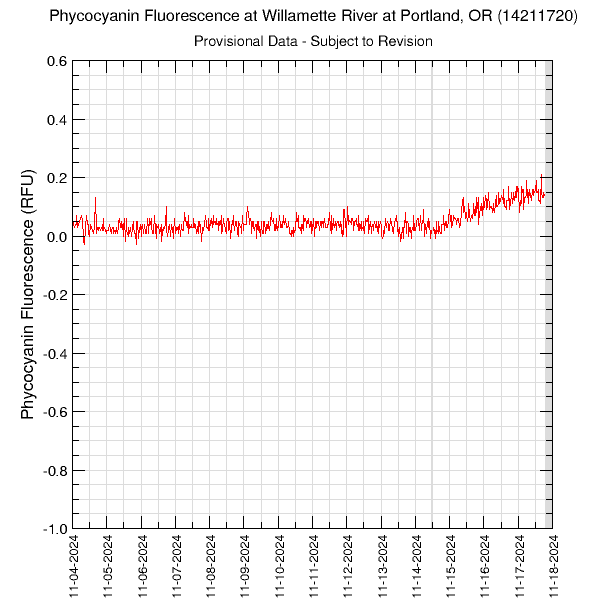
Phycocyanin Fluorescence (RFU)Graph updated: Tuesday - Jun 30, 2026 at 13:59:28 EDT
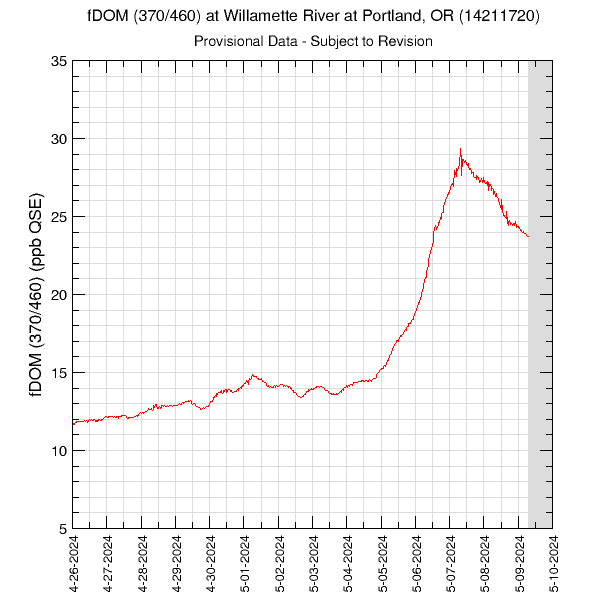
FDOM (ppb QSE)Graph updated: Tuesday - Jun 30, 2026 at 13:59:37 EDT
Nitrate (mg/L)Graph updated: Tuesday - Jun 30, 2026 at 13:59:31 EDT
|
![]() U.S. Department of the Interior |
U.S. Geological Survey
U.S. Department of the Interior |
U.S. Geological Survey
URL: https://or.water.usgs.gov/will_morrison/monitors/will_morrison_all_14.html
Page Contact Information: Erin Leahy
Page Last Modified: Wednesday - Apr 2, 2025 at 14:54:29 EDT