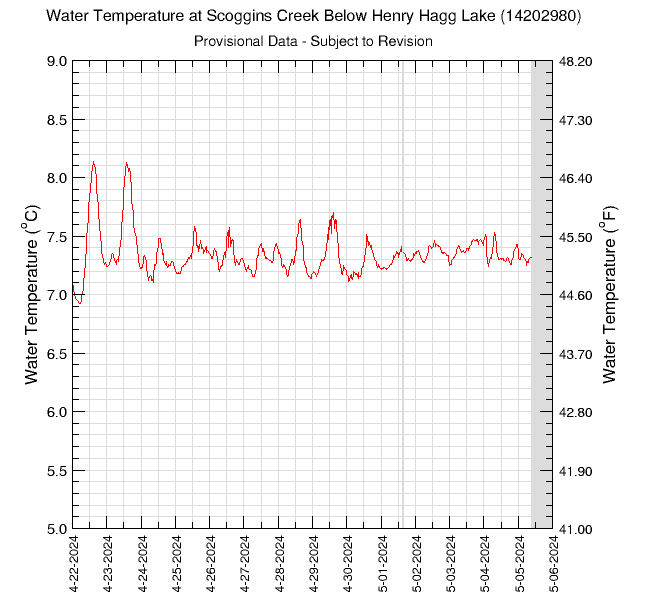
14-Days of Data for Scoggins Creek Below Henry Hagg Lake (14202980)The chlorophyll, phycocyanin, and fDOM sensors were removed on 04-Oct-2021. This monitor is located in Scoggins Creek Below Henry Hagg Lake. Data are collected every 30 minutes. Periods with no data are plotted as grey areas. These data are provisional and are subject to revision. Water TemperatureGraph updated: Saturday - Jul 4, 2026 at 05:00:40 EDT
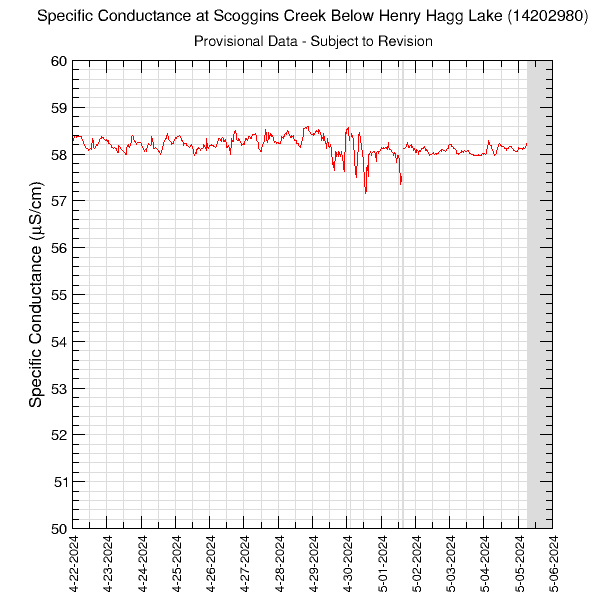
Specific ConductanceGraph updated: Saturday - Jul 4, 2026 at 05:00:37 EDT
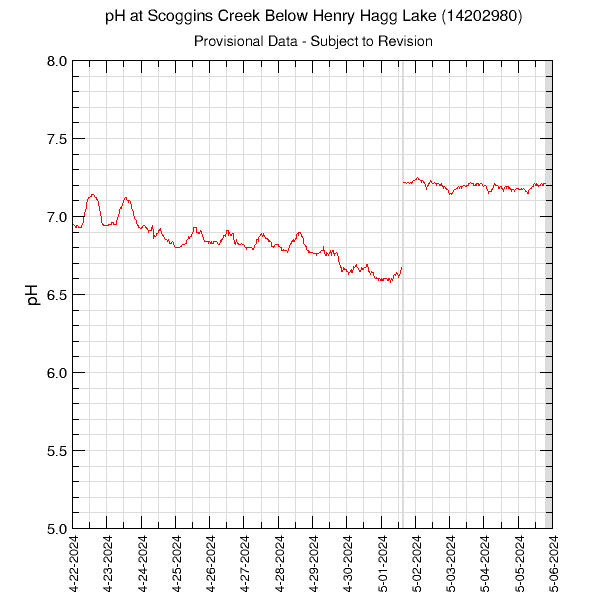
pHGraph updated: Saturday - Jul 4, 2026 at 05:00:39 EDT
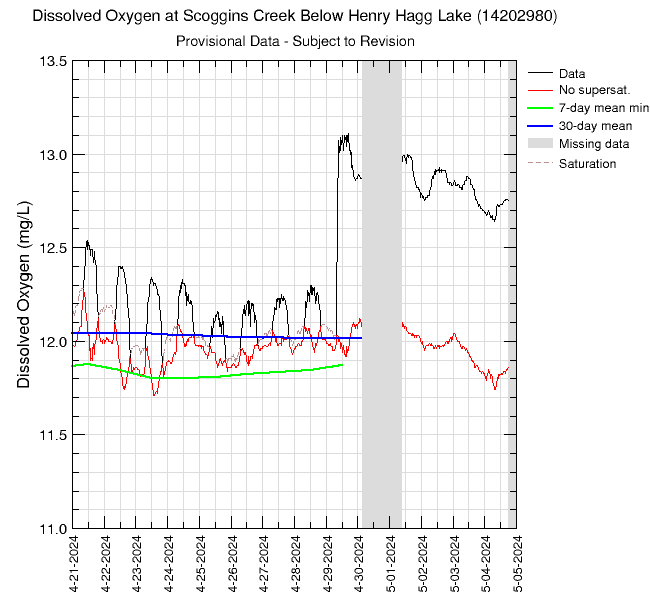
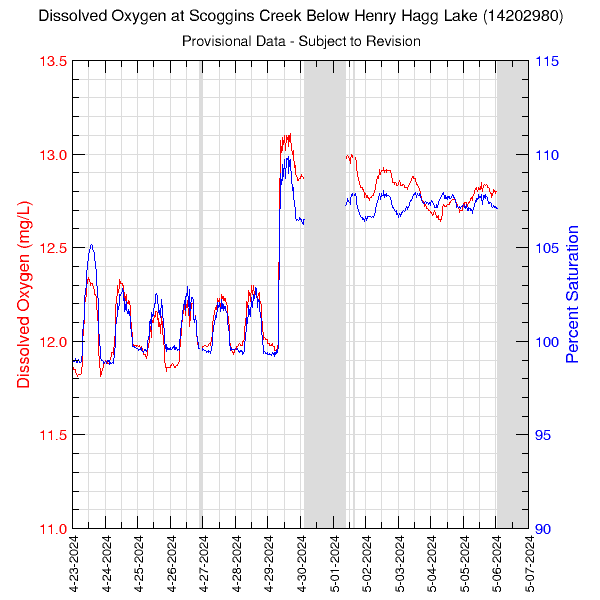
Dissolved OxygenIn the graph below, "Data" are the raw data, "No supersat." are the half-hourly data with a ceiling of 100% saturation, "7-day mean min" represents the 7-day running average of daily minima with no credit for supersaturation, and "30-day mean" is the 30-day running average with no credit for supersaturation. The red line will often plot on top of the black one. If the 7-day or 30-day lines are not plotted, it is due to missing data in that period. "Saturation" represents the 100% saturation value for dissolved oxygen. Graph updated: Saturday - Jul 4, 2026 at 05:00:38 EDT
Oxygen Percent SaturationData in the graph are plotted against the axis of the same color. Percent saturation is estimated as a function of water temperature and barometric pressure at this site. Graph updated: Saturday - Jul 4, 2026 at 05:00:38 EDT
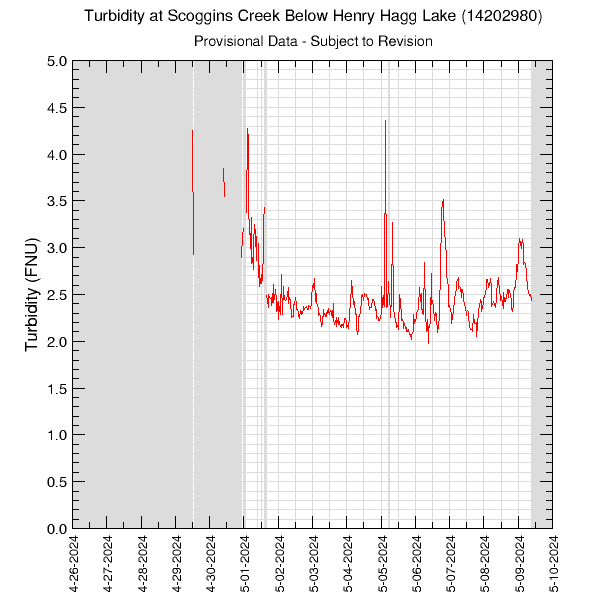
TurbidityGraph updated: Saturday - Jul 4, 2026 at 05:00:41 EDT
|
![]() U.S. Department of the Interior |
U.S. Geological Survey
U.S. Department of the Interior |
U.S. Geological Survey
URL: https://or.water.usgs.gov/tualatin/monitors/scoggins_all_14.html
Page Contact Information: Erin Leahy
Page Last Modified: Wednesday - Apr 2, 2025 at 14:41:30 EDT