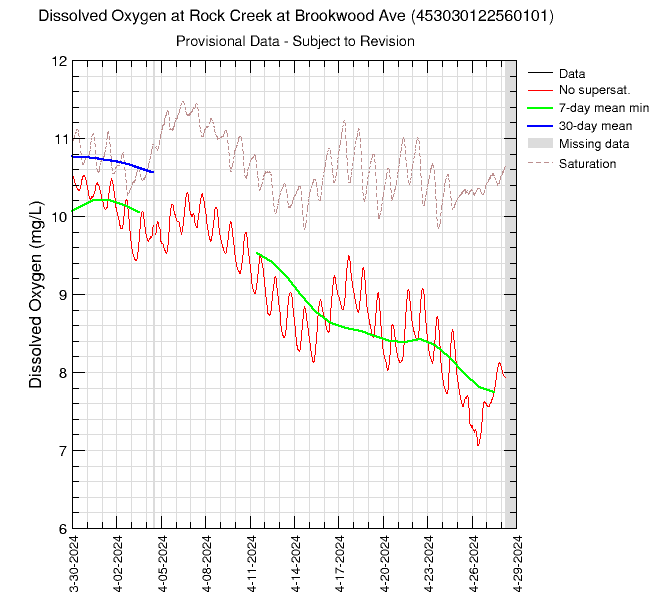
30-Days of Dissolved Oxygen for Rock Creek at Brookwood Avenue (453030122560101)Data are downloaded and processed every 6 hours. This monitor is located in Rock Creek at Brookwood Avenue. Data are collected every half hour. In the graph below, "Data" are the raw data, "No supersat." are the half-hourly data with a ceiling of 100% saturation, "7-day mean min" represents the 7-day running average of daily minima with no credit for supersaturation, and "30-day mean" is the 30-day running average with no credit for supersaturation. The red line will often plot on top of the black one. If the 7-day or 30-day lines are not plotted, it is due to missing data in that period. "Saturation" represents the 100% saturation value for dissolved oxygen. These data are provisional and are subject to revision. Graph updated: Saturday - Jul 4, 2026 at 05:00:26 EDT
|
![]() U.S. Department of the Interior |
U.S. Geological Survey
U.S. Department of the Interior |
U.S. Geological Survey
URL: https://or.water.usgs.gov/tualatin/monitors/rock_brookwood_do_30.html
Page Contact Information: Erin Leahy
Page Last Modified: Wednesday - Apr 2, 2025 at 14:41:15 EDT