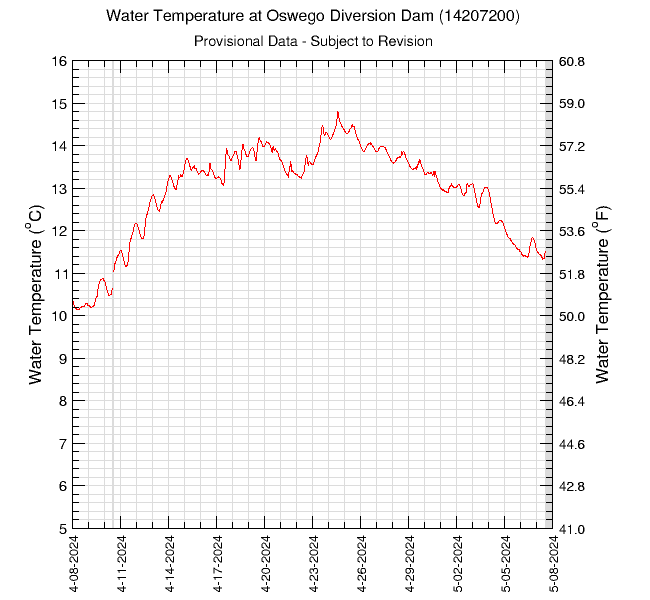
30-Days of Data at the Oswego Diversion Dam (14207200)Data are downloaded and processed every 6 hours. The Oswego Diversion Dam is located in the Tualatin River at river mile 3.4. Data are collected on the half hour. Periods with no data are plotted as grey areas. These data are provisional and are subject to revision. Water TemperatureGraph updated: Tuesday - Jun 23, 2026 at 23:00:21 EDT
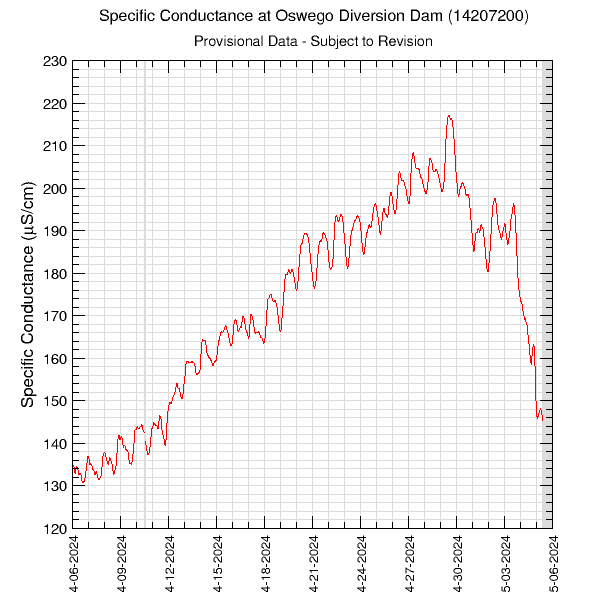
Specific ConductanceGraph updated: Tuesday - Jun 23, 2026 at 23:00:16 EDT
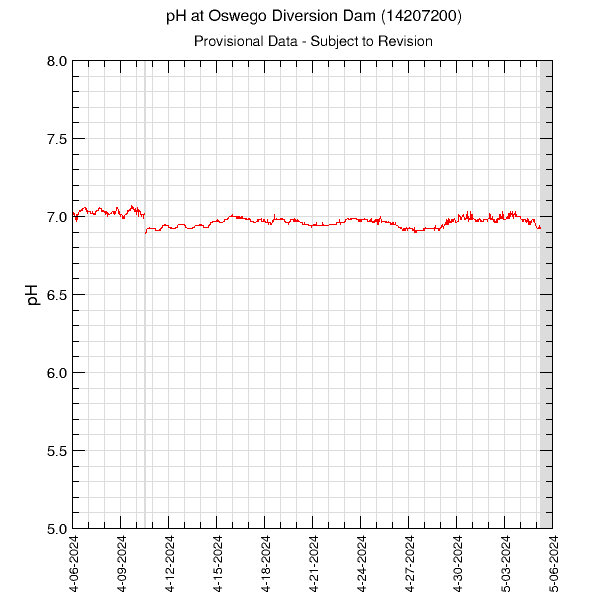
pHGraph updated: Tuesday - Jun 23, 2026 at 23:00:20 EDT
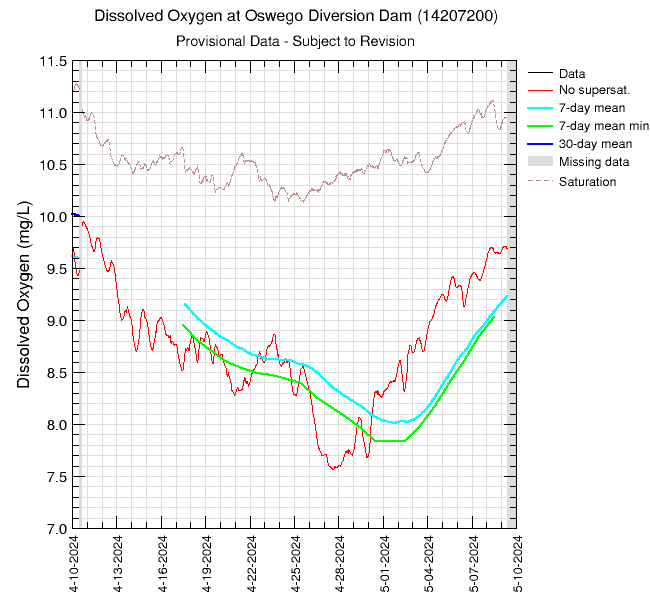
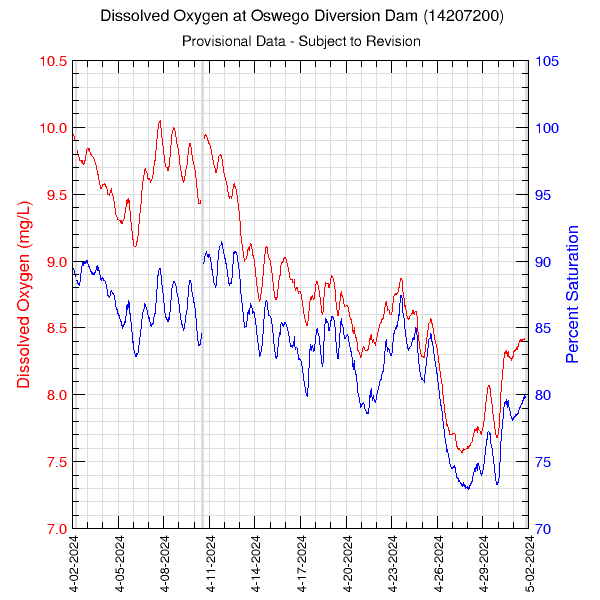
Dissolved OxygenIn the graph below, "Data" are the raw data, "No supersat." are the half-hourly data with a ceiling of 100% saturation, "7-day mean min" represents the 7-day running average of daily minima with no credit for supersaturation, and "30-day mean" is the 30-day running average with no credit for supersaturation. The red line will often plot on top of the black one. If the 7-day or 30-day lines are not plotted, it is due to missing data in that period. "Saturation" represents the 100% saturation value for dissolved oxygen. Graph updated: Tuesday - Jun 23, 2026 at 23:00:17 EDT
Oxygen Percent SaturationData in the graph are plotted against the axis of the same color. Percent saturation is estimated as a function of water temperature and barometric pressure at this site. Graph updated: Tuesday - Jun 23, 2026 at 23:00:18 EDT
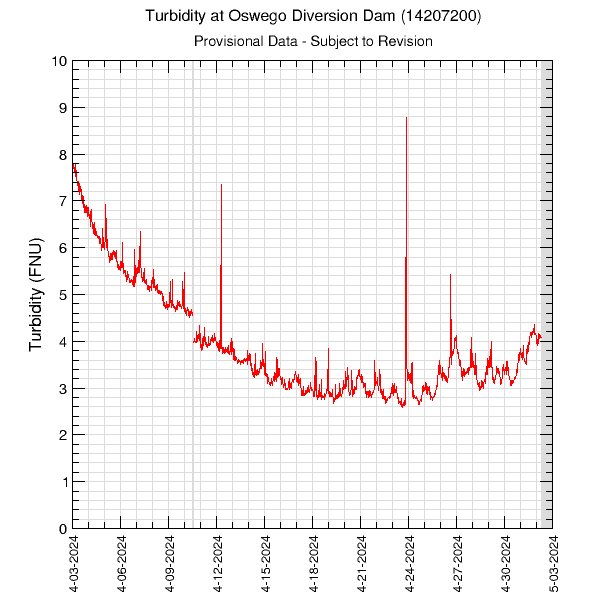
TurbidityTurbidity data are measured in FNU units. Graph updated: Tuesday - Jun 23, 2026 at 23:00:22 EDT
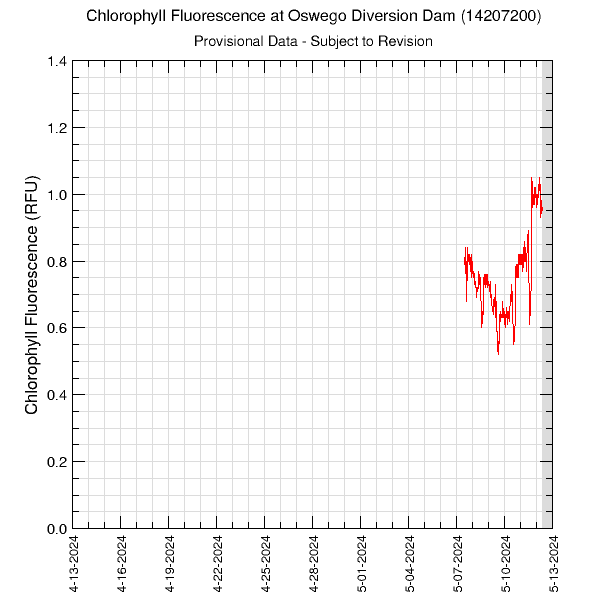
Chlorophyll FluorescenceThe chlorophyll fluorescence sensor provides an estimate of the amount of chlorophyll pigment found in algae based on a fluorescence response. Graph updated: Tuesday - Jun 23, 2026 at 23:00:19 EDT
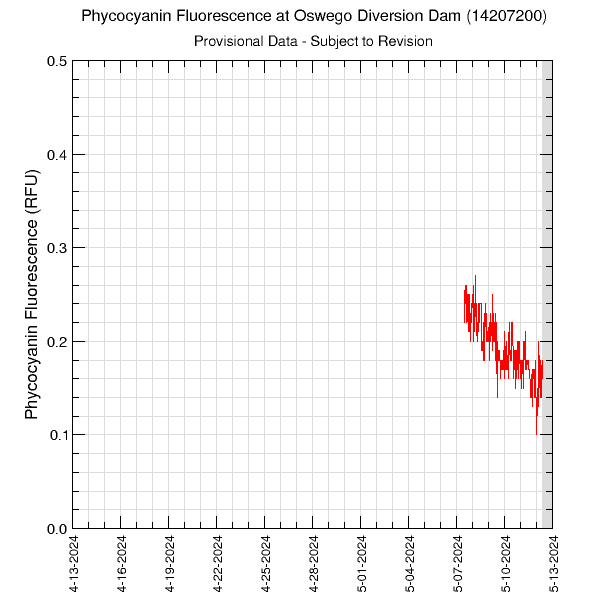
Phycocyanin FluorescenceThe phycocyanin fluorescence sensor provides an estimate of the amount of phycocyanin pigment found in blue-green algae based on a fluorescence response. Graph updated: Tuesday - Jun 23, 2026 at 23:00:19 EDT
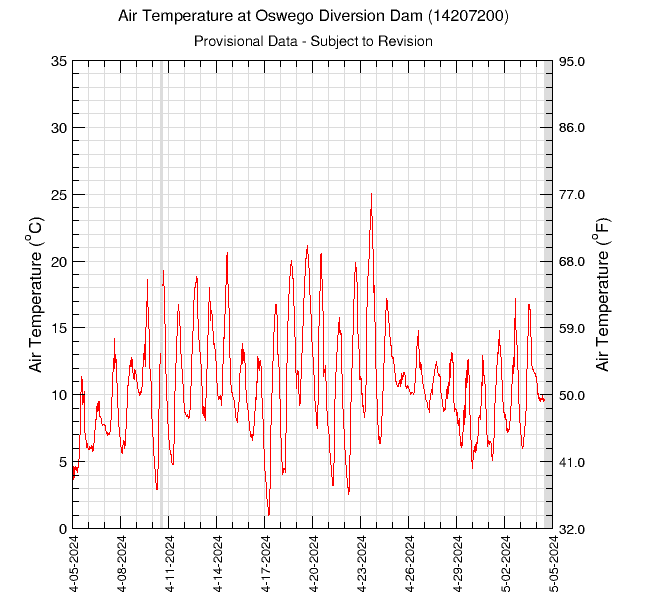
Air TemperatureGraph updated: Tuesday - Jun 23, 2026 at 23:00:14 EDT
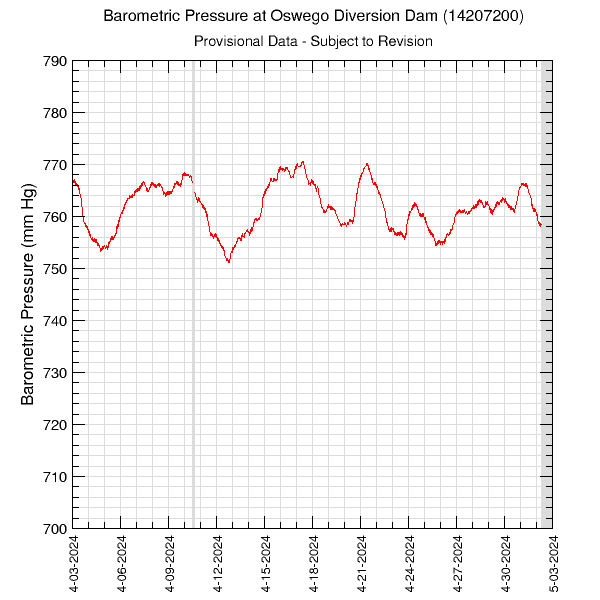
Barometric PressureGraph updated: Tuesday - Jun 23, 2026 at 23:00:15 EDT
|
![]() U.S. Department of the Interior |
U.S. Geological Survey
U.S. Department of the Interior |
U.S. Geological Survey
URL: https://or.water.usgs.gov/tualatin/monitors/oswegodam_all_30.html
Page Contact Information: Erin Leahy
Page Last Modified: Wednesday - Apr 2, 2025 at 14:40:49 EDT