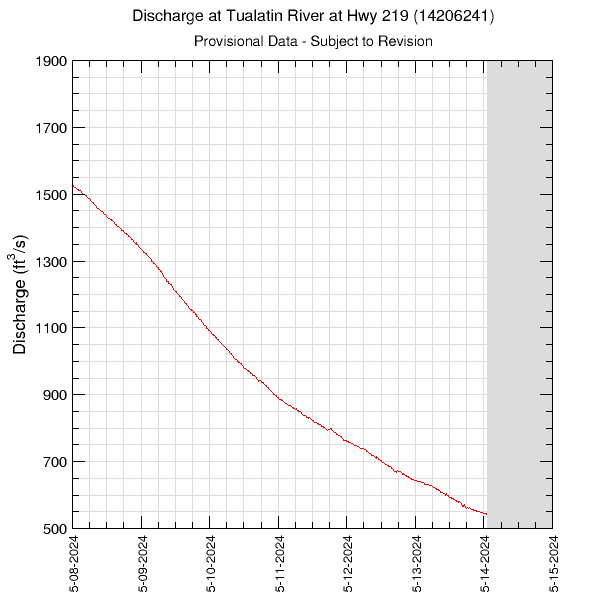
7-Days of Data from the Tualatin River at Highway 219 (14206241)Data are downloaded and processed nearly every hour. These data are provided by USGS and Clean Water Services. Water-quality data are collected on the half hour, and gage height and streamflow every 15 minutes. Periods with no data are plotted as grey areas. Recent data are provisional and subject to revision. StreamflowDuring periods of high water, discharge data may not be available because the water depth may exceed the range of the rating curve. Graph updated: Saturday - Jul 4, 2026 at 05:00:10 EDT
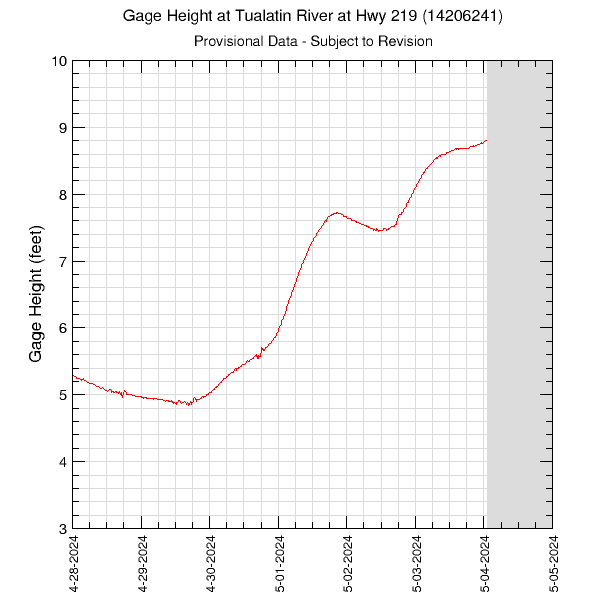
Gage HeightGraph updated: Saturday - Jul 4, 2026 at 05:00:09 EDT
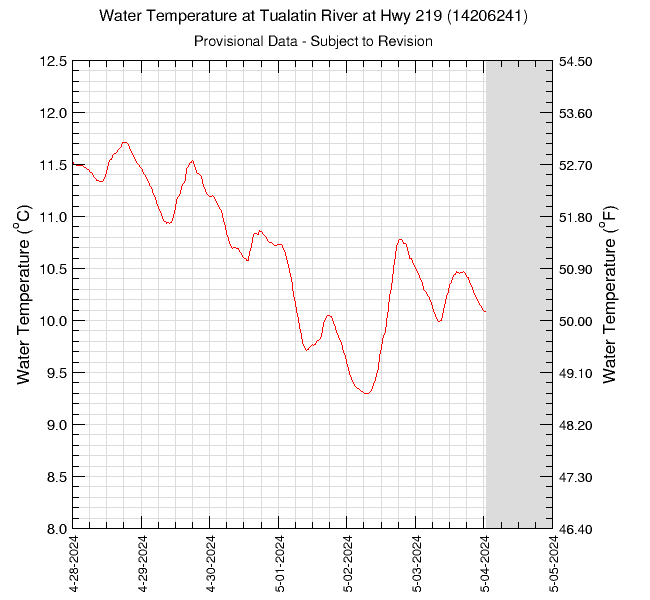
Water TemperatureGraph updated: Saturday - Jul 4, 2026 at 05:00:11 EDT
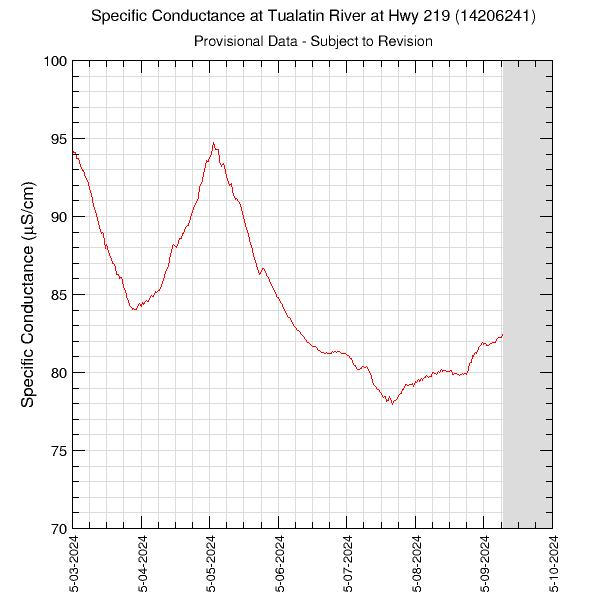
Specific ConductanceGraph updated: Saturday - Jul 4, 2026 at 05:00:06 EDT
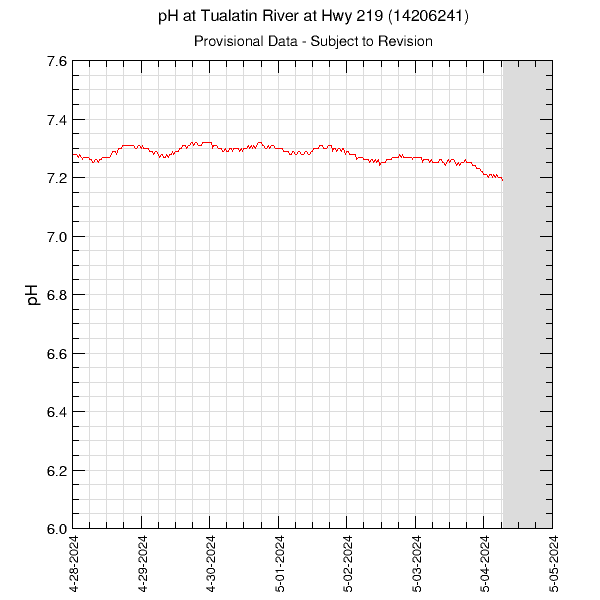
pHGraph updated: Saturday - Jul 4, 2026 at 05:00:09 EDT
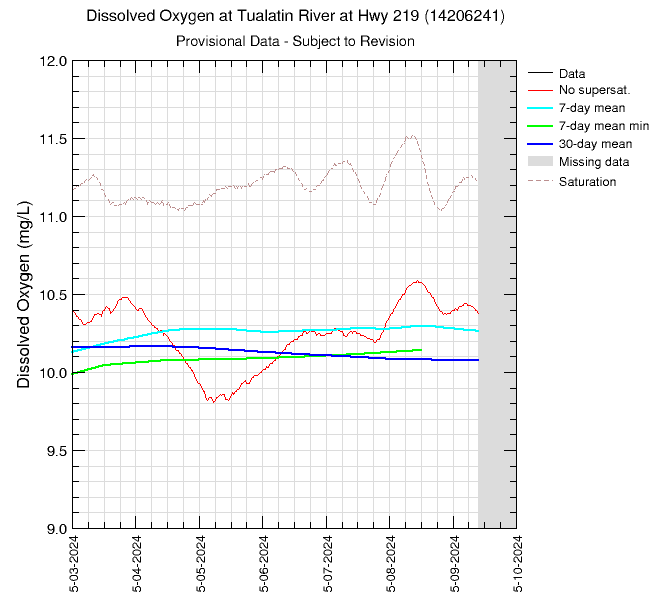
Dissolved OxygenIn the graph below, "Data" are the raw data, "No supersat." are the half-hourly data with a ceiling of 100% saturation, "7-day mean" represents the 7-day running average with no credit for supersaturation, "7-day mean min" represents the 7-day running average of daily minima with no credit for supersaturation, and "30-day mean" is the 30-day running average with no credit for supersaturation. The red line will often plot on top of the black one. If the 7-day or 30-day lines are not plotted, it is due to missing data in that period. "Saturation" represents the 100% saturation value for dissolved oxygen. Graph updated: Saturday - Jul 4, 2026 at 05:00:07 EDT
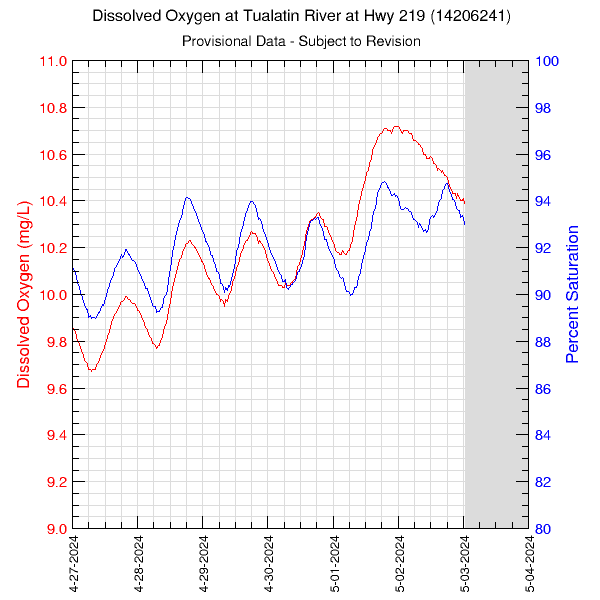
Oxygen Percent SaturationData in the graph are plotted against the axis of the same color. Percent saturation is estimated as a function of water temperature at this site and barometric pressure at a nearby site. Graph updated: Saturday - Jul 4, 2026 at 05:00:08 EDT
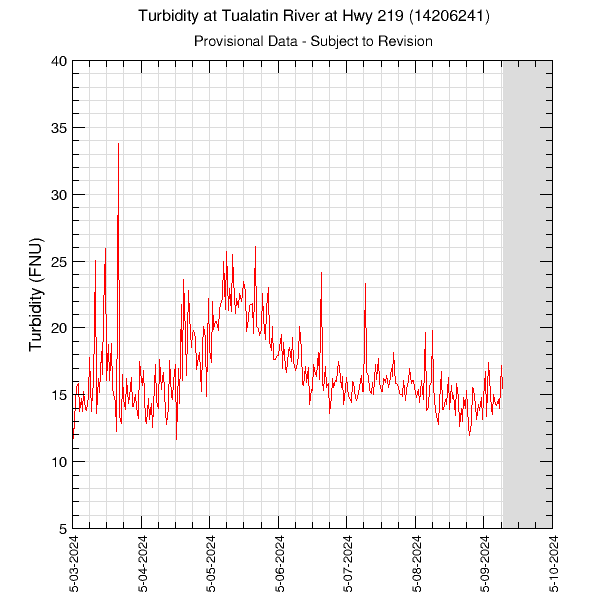
TurbidityTurbidity data are measured in FNU units. Graph updated: Saturday - Jul 4, 2026 at 05:00:12 EDT
|
![]() U.S. Department of the Interior |
U.S. Geological Survey
U.S. Department of the Interior |
U.S. Geological Survey
URL: https://or.water.usgs.gov/tualatin/monitors/hwy219_all_7.html
Page Contact Information: Erin Leahy
Page Last Modified: Wednesday - Apr 2, 2025 at 14:40:35 EDT