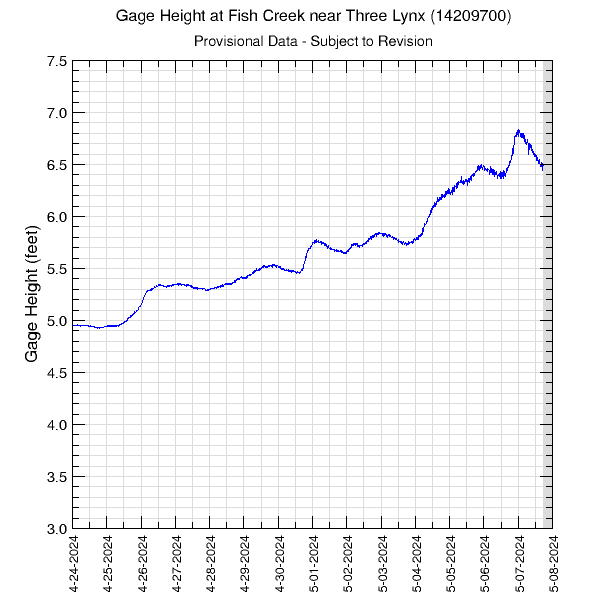
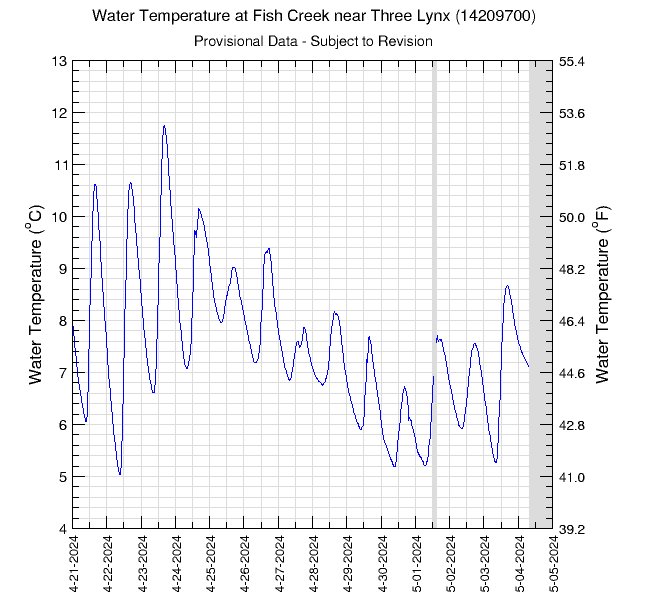
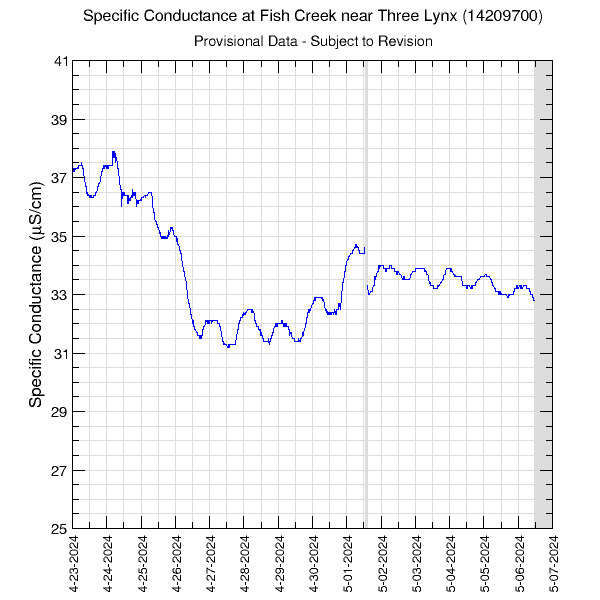
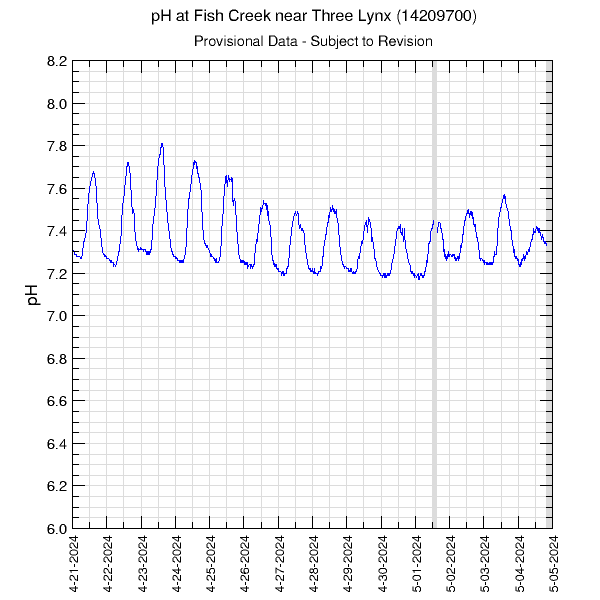
Data at this site are collected every 15 minutes. Periods with no data are plotted as grey areas. All data presented here are provisional and are subject to revision.
Graph updated: Sunday - Jun 28, 2026 at 09:29:16 EDT
Graph updated: Sunday - Jun 28, 2026 at 09:29:16 EDT
Graph updated: Sunday - Jun 28, 2026 at 09:29:15 EDT
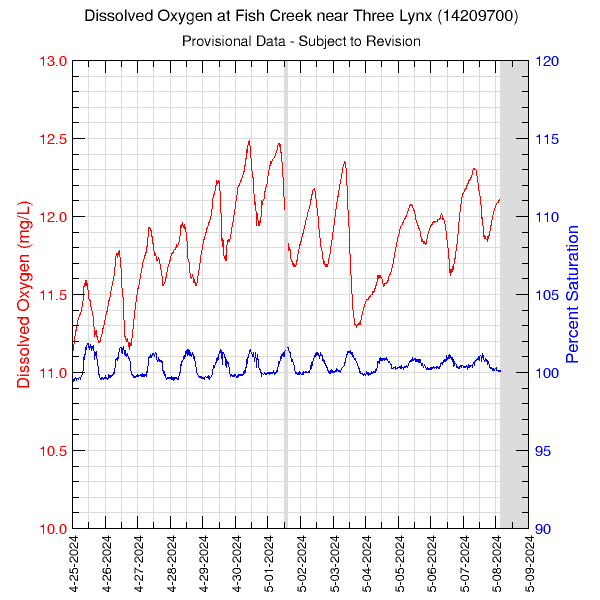
Dissolved oxygen data in the graph are plotted against the axis of the same color. Percent saturation is estimated as a function of water temperature at this site and barometric pressure at a nearby location; elevation corrections are included.
Graph updated: Sunday - Jun 28, 2026 at 09:29:15 EDT
Graph updated: Sunday - Jun 28, 2026 at 09:29:16 EDT
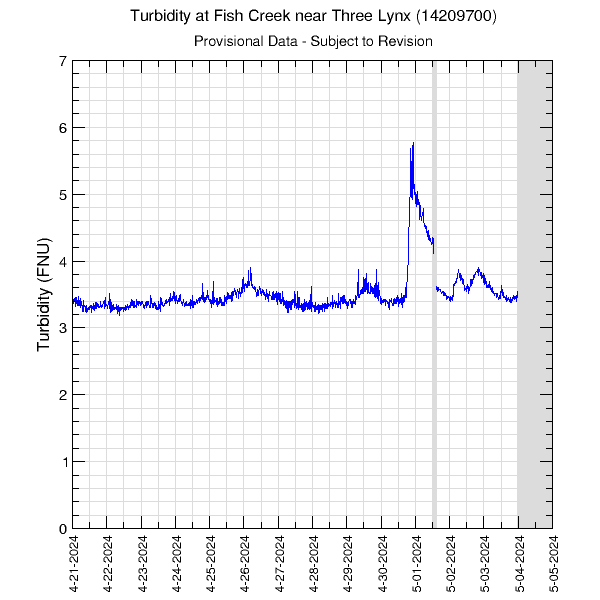
Turbidity data are measured in FNU units.
Periodic, single-point spikes in turbidity may be caused by bubbles, leaves, and/or clumps of detritus or algae passing near the probe. Such spikes do not necessarily represent a degradation in bulk water quality.
Graph updated: Sunday - Jun 28, 2026 at 09:29:17 EDT
Graph updated: Sunday - Jun 28, 2026 at 09:29:17 EDT
![]() U.S. Department of the Interior |
U.S. Geological Survey
U.S. Department of the Interior |
U.S. Geological Survey
URL: https://or.water.usgs.gov/proj/or176/monitors/fish_creek_all_14.html
Page Contact Information: Abigail Tomasek
Page Last Modified: Friday - Apr 4, 2025 at 13:58:33 EDT
