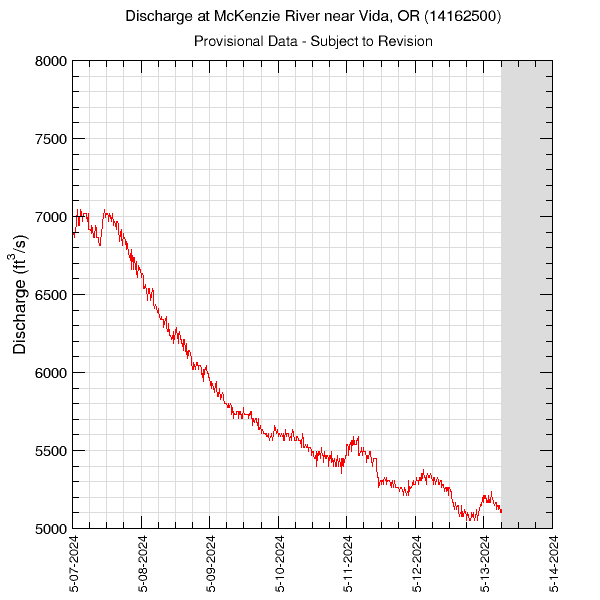
7-Days of Data at McKenzie River at Vida, OR (14162500)Periods with no data are plotted as grey areas. These data may be provisional and subject to revision. StreamflowGraph updated: Sunday - May 24, 2026 at 11:29:11 EDT
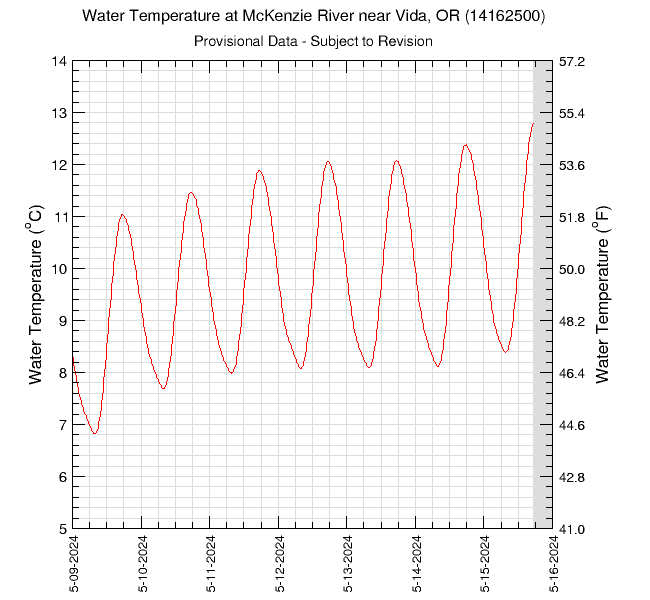
Water TemperatureGraph updated: Sunday - May 24, 2026 at 11:29:12 EDT
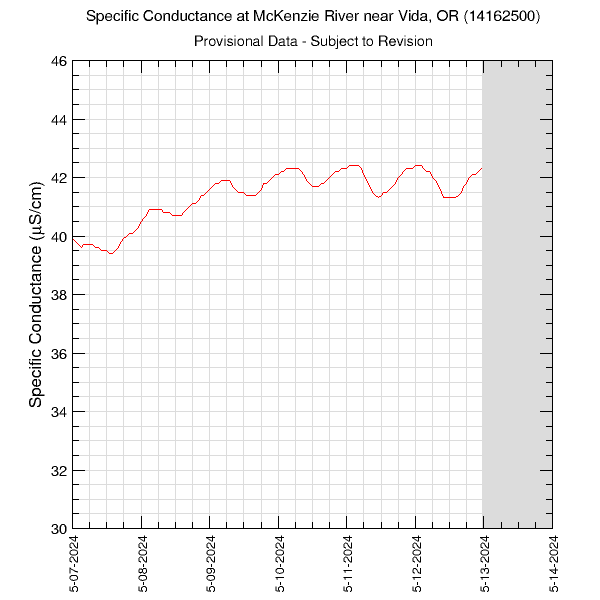
Specific ConductanceGraph updated: Sunday - May 24, 2026 at 11:29:06 EDT
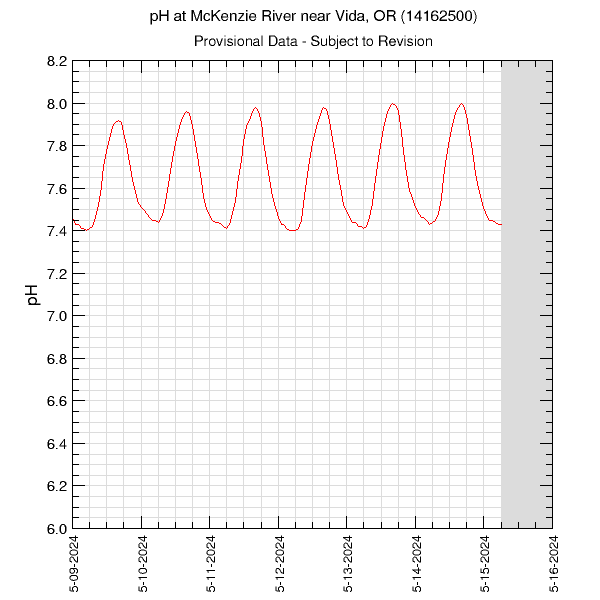
pHGraph updated: Sunday - May 24, 2026 at 11:29:10 EDT
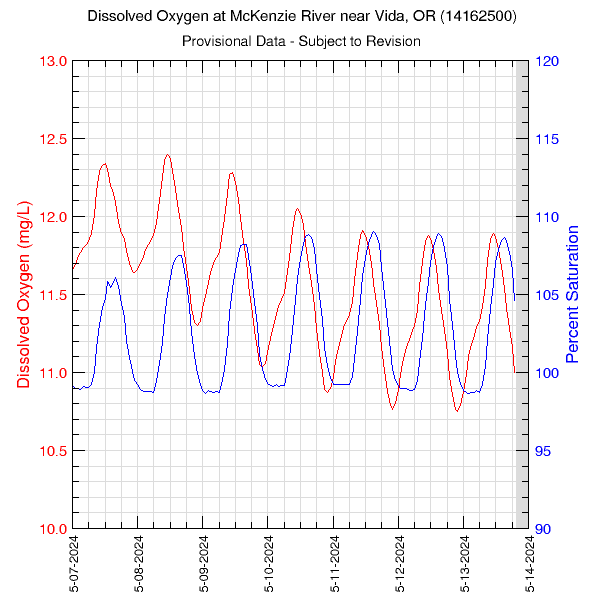
Dissolved OxygenData in the graph are plotted against the axis of the same color. Percent saturation is estimated as a function of water temperature and site elevation. Graph updated: Sunday - May 24, 2026 at 11:29:07 EDT
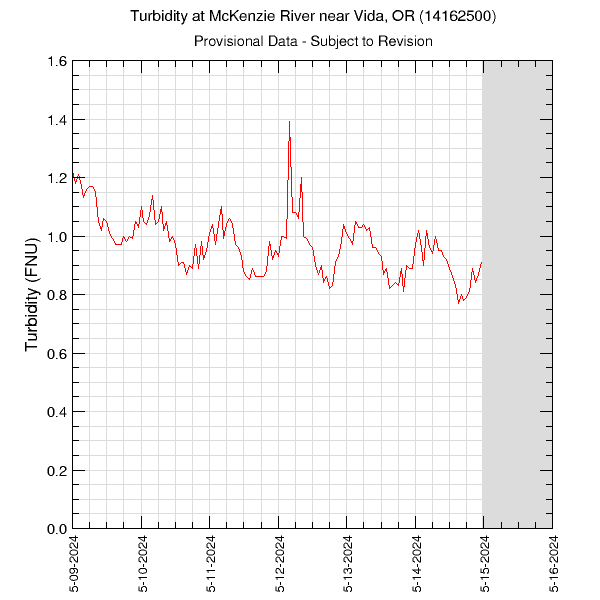
TurbidityTurbidity data are measured in FNU units. Graph updated: Sunday - May 24, 2026 at 11:29:13 EDT
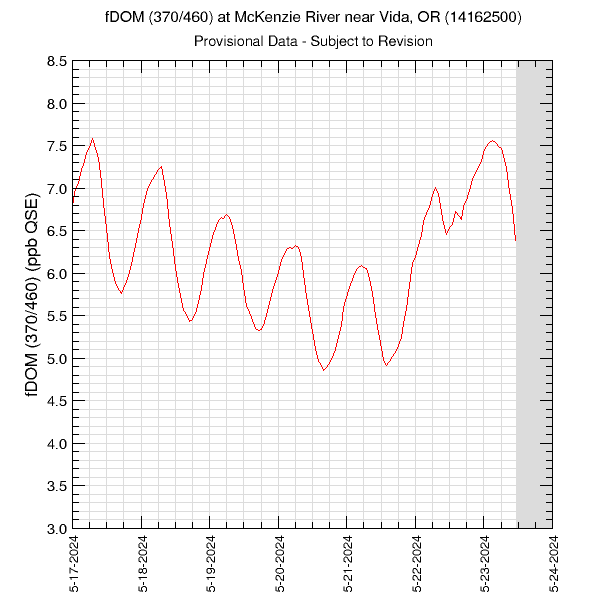
fDOMGraph updated: Sunday - May 24, 2026 at 11:29:14 EDT
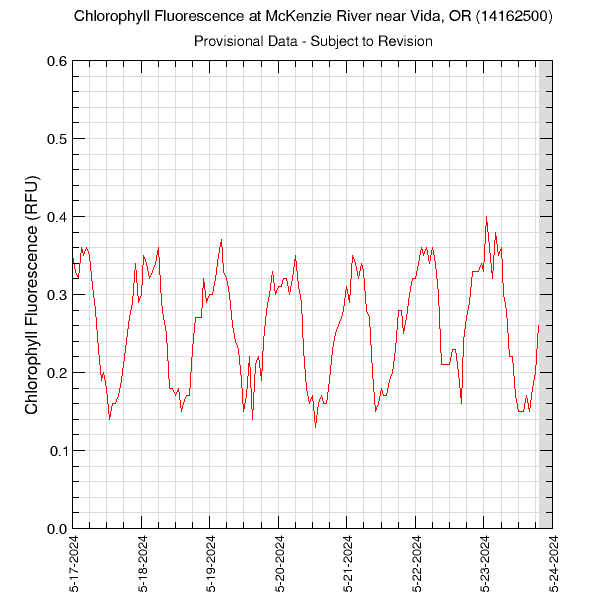
Chlorophyll FluorescenceGraph updated: Sunday - May 24, 2026 at 11:29:08 EDT
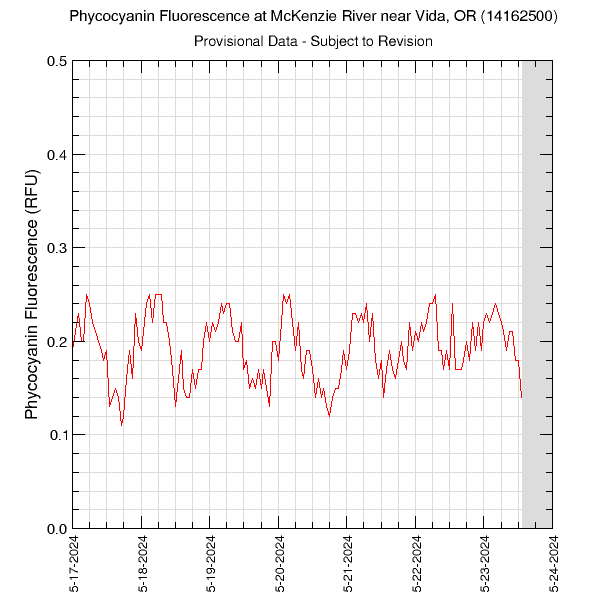
Phycocyanin FluorescenceGraph updated: Sunday - May 24, 2026 at 11:29:09 EDT
|
![]() U.S. Department of the Interior |
U.S. Geological Survey
U.S. Department of the Interior |
U.S. Geological Survey
URL: https://or.water.usgs.gov/mckenzie/monitors/vida_all_7.html
Page Contact Information: Oregon Webteam
Page Last Modified: Thursday - May 16, 2024 at 10:57:03 EDT