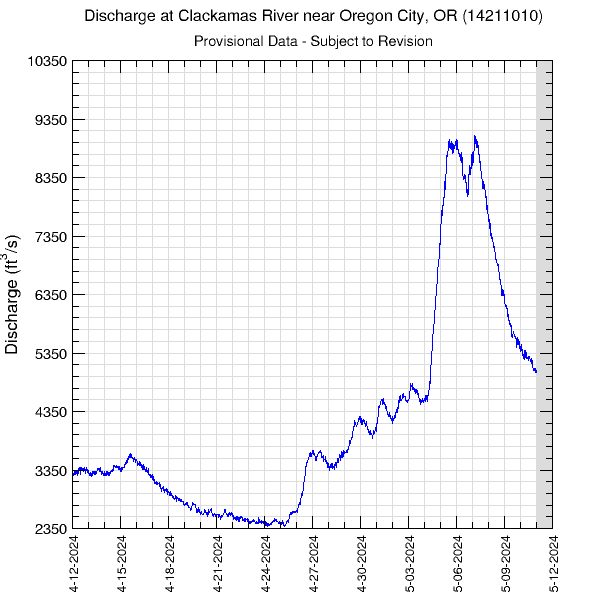
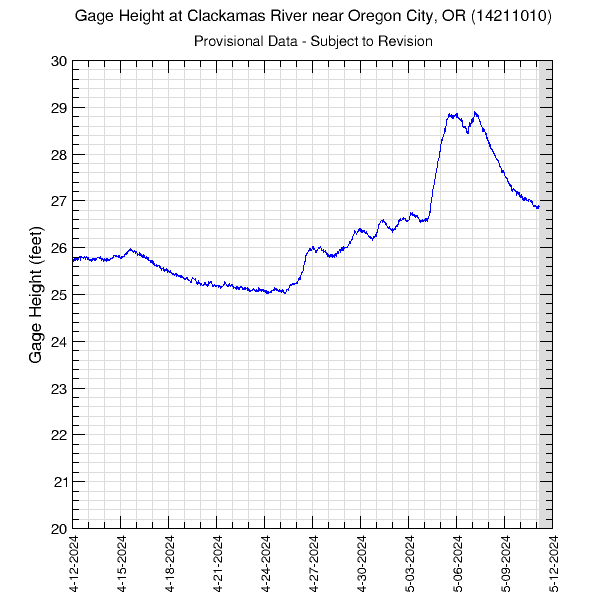
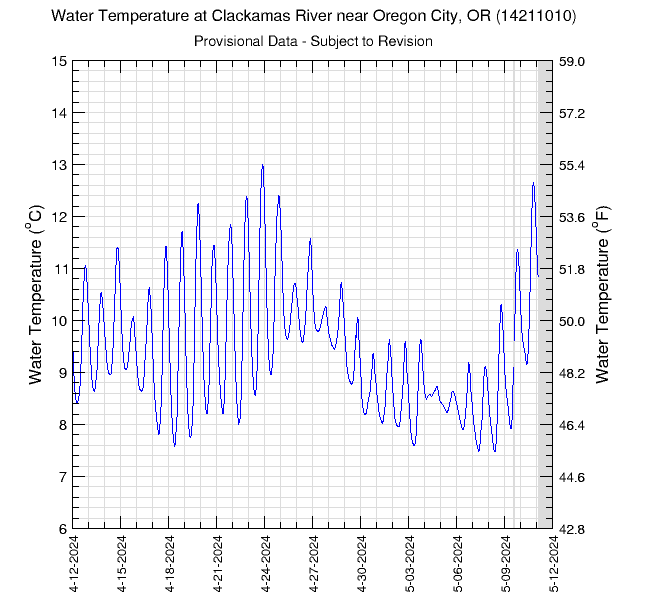
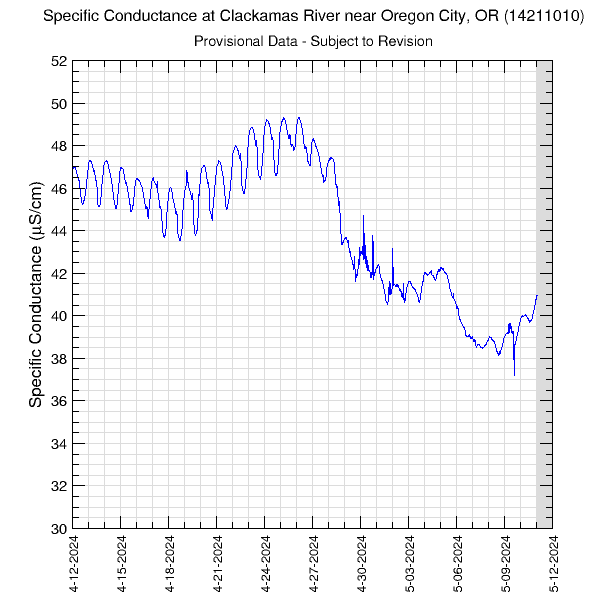
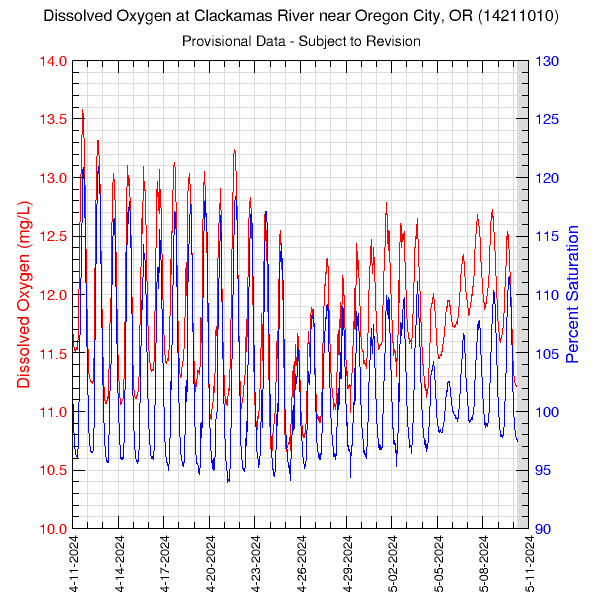
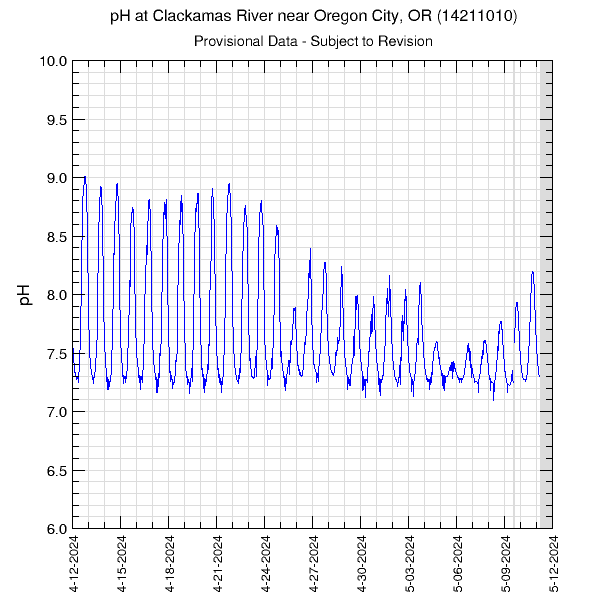
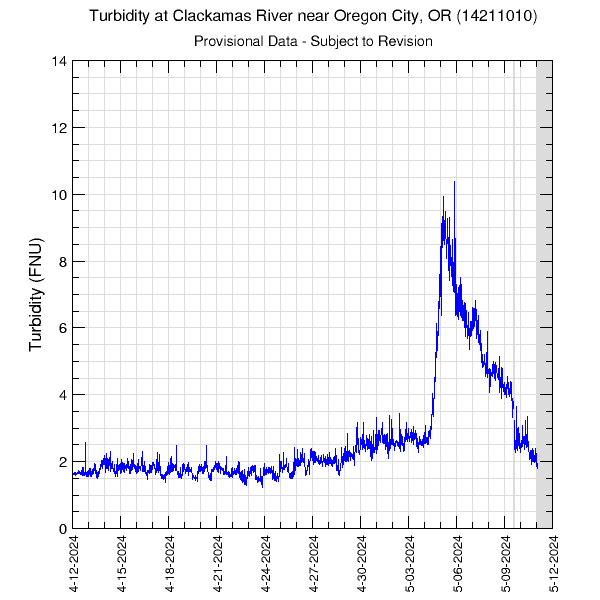
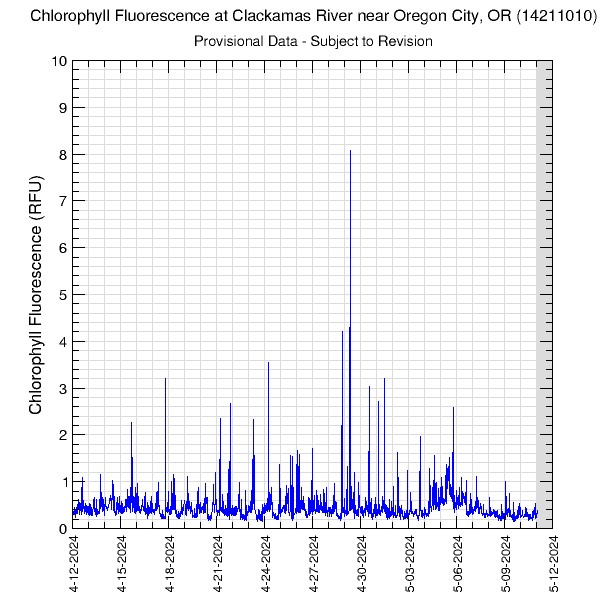
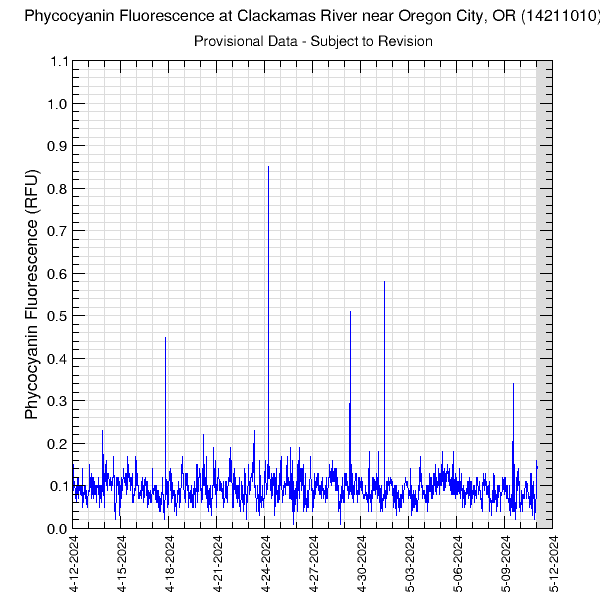
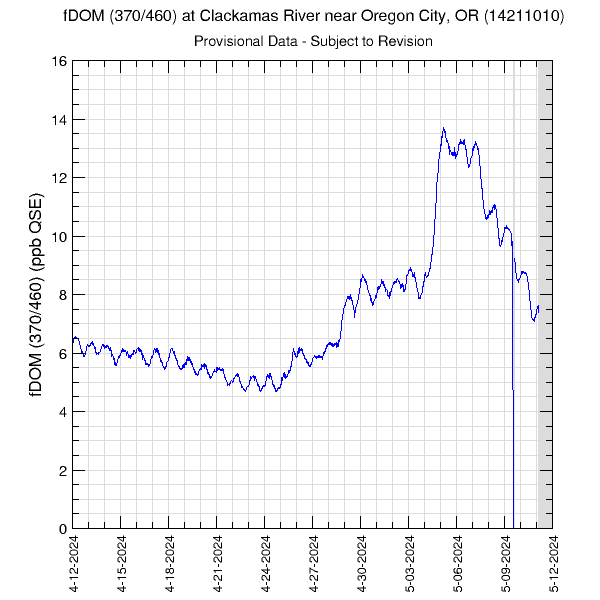
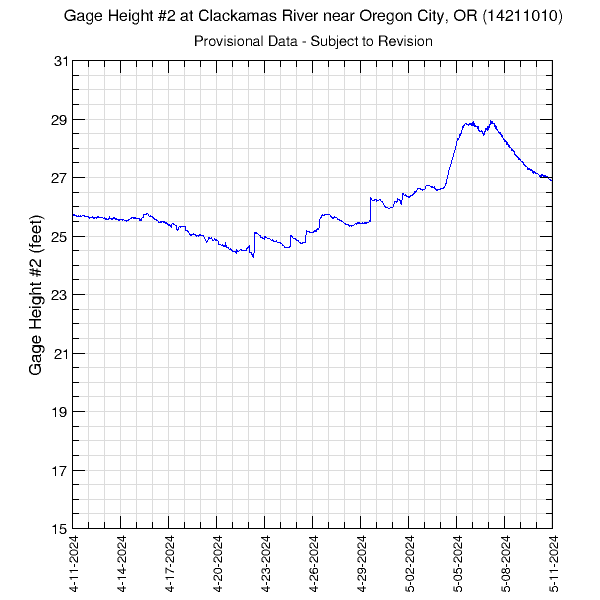
Data at this site are collected every 30 minutes. Periods with no data are plotted as grey areas. All data presented here are provisional and are subject to revision.
Graph updated: Thursday - Jul 2, 2026 at 01:29:37 EDT
Graph updated: Thursday - Jul 2, 2026 at 01:29:36 EDT
Graph updated: Thursday - Jul 2, 2026 at 01:29:38 EDT
Graph updated: Thursday - Jul 2, 2026 at 01:29:34 EDT
Dissolved oxygen data in the graph are plotted against the axis of the same color. Percent saturation is estimated as a function of water temperature at this site and barometric pressure at a nearby location; elevation corrections are included.
Graph updated: Thursday - Jul 2, 2026 at 01:29:34 EDT
Graph updated: Thursday - Jul 2, 2026 at 01:29:37 EDT
Turbidity data are measured in FNU units.
Graph updated: Thursday - Jul 2, 2026 at 01:29:38 EDT
The chlorophyll fluorescence sensor provides an estimate of the amount of chlorophyll pigment found in algae based on the fluorescence response.
Graph updated: Thursday - Jul 2, 2026 at 01:29:35 EDT
The phycocyanin fluorescence sensor provides an estimate of the amount of phycocyanin pigment found in blue-green algae based on the fluorescence response.
Graph updated: Thursday - Jul 2, 2026 at 01:29:35 EDT
Graph updated: Thursday - Jul 2, 2026 at 01:29:39 EDT
Graph updated: Thursday - Jul 2, 2026 at 01:29:36 EDT
![]() U.S. Department of the Interior |
U.S. Geological Survey
U.S. Department of the Interior |
U.S. Geological Survey
URL: https://or.water.usgs.gov/clackamas/monitors/oregon_city_all_30.html
Page Contact Information: Abigail Tomasek
Page Last Modified: Friday - Apr 4, 2025 at 13:58:40 EDT
