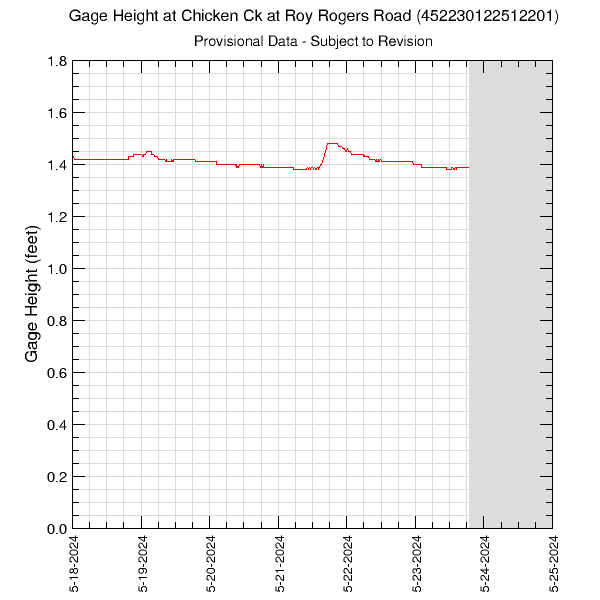
7-Days of Data for Chicken Creek at Roy Rogers Road (452230122512201)Data are downloaded multiple times per day. The U.S. Geological Survey collects continuous water-quality data and West Consultants collects gage height data in Chicken Creek at Roy Rogers Road in partnership with Clean Water Services. The gage height data are related to water depth, and are used to estimate streamflow. Gage height data are collected every 15 minutes. Water-quality data are collected every 30 minutes. Periods with no data are plotted as grey areas. These data are provisional and are subject to revision. The gage height data were NOT collected by the U.S. Geological Survey. West Consultants is allowing USGS to share the gage height data, but the data are provided without warranty or any guarantee as to their suitability for any particular purpose. Gage HeightGraph updated: Wednesday - May 1, 2024 at 20:59:04 EDT
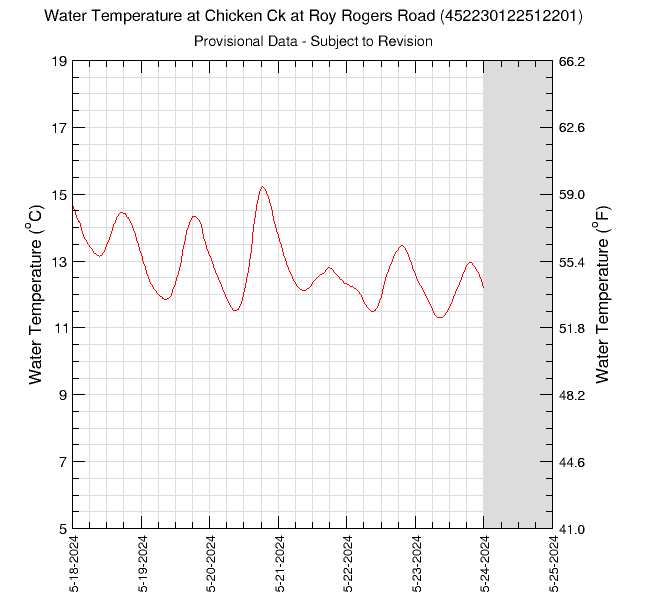
Water TemperatureGraph updated: Wednesday - May 1, 2024 at 20:59:04 EDT
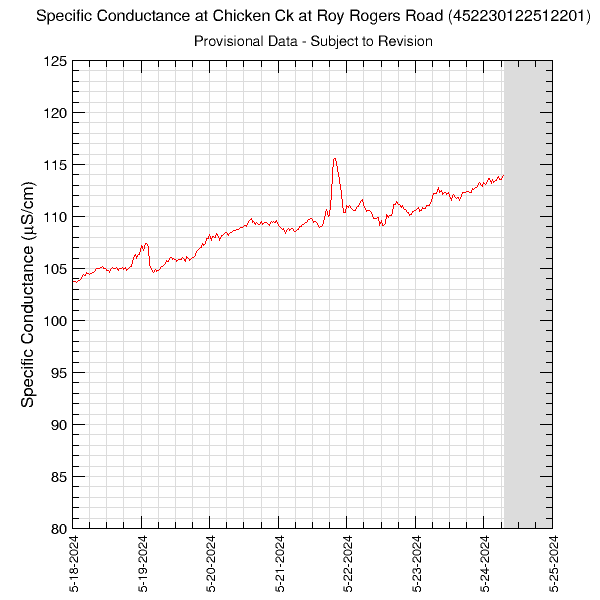
Specific ConductanceGraph updated: Wednesday - May 1, 2024 at 20:59:04 EDT
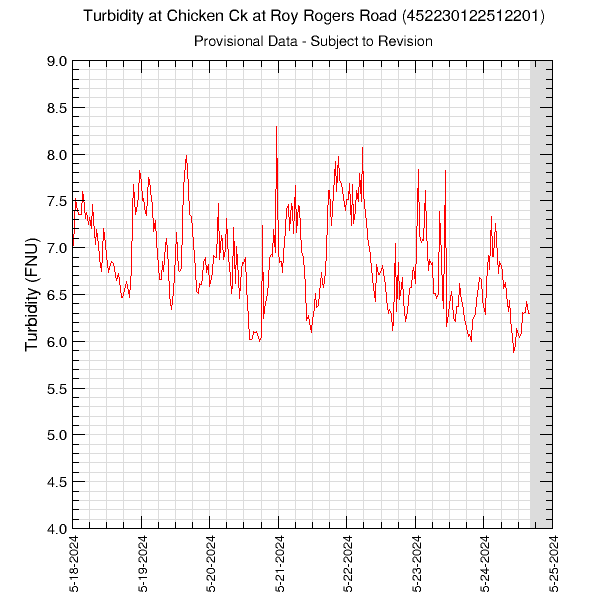
TurbidityTurbidity data are measured in FNU units. Graph updated: Wednesday - May 1, 2024 at 20:59:05 EDT
|
![]() U.S. Department of the Interior |
U.S. Geological Survey
U.S. Department of the Interior |
U.S. Geological Survey
URL: https://or.water.usgs.gov/tualatin/monitors/chicken_all_7.html
Page Contact Information: Stewart Rounds
Page Last Modified: Friday - Apr 3, 2020 at 19:19:48 EDT