PROJECT CHIEF: Tamara M. Wood
COOPERATOR: Bureau of Reclamation
Upper Klamath Lake is a large, shallow lake in southern Oregon. The lake is the source of the Klamath River, which flows through California to the Pacific Ocean. The lower Klamath River provides spawning and rearing habitat for endangered salmon. The lake was historically eutrophic but has become hypereutrophic, presumably due to land-use practices in the basin (U.S. Fish and Wildlife Service, 1993). As a result, the lake’s algal community has shifted to a monoculture of the blue-green alga Aphanizomemon flos-aquae, massive blooms of which have been directly related to episodes of poor water quality in Upper Klamath Lake. Widespread nuisance blooms of A. flos-aquae have occurred during the summer and fall for the past 40 years. Blooms of A. flos-aquae turn the lake water an opaque green.
Water quality problems that coincide with the blooms and subsequent decay of dead algae include foul odors, pH of 8.5 and higher, dissolved oxygen concentrations that fluctuate from supersaturated to anoxic, elevated ammonia concentrations, and occasionally extensive fish kills. The degraded water quality has been proposed as a contributing factor in the decline in populations of shortnose (Chasmistes brevirostris) and Lost River (Deltistes luxatus) suckers, which were both listed in 1988 as Federally Endangered Species. These fish are of cultural importance to the Klamath Tribes.
Paleolimnological evidence shows that water quality conditions in Upper Klamath Lake have changed since the early 20th century (Eilers and others, 2004). The most significant changes in the basin during the 20th century were the result of agricultural modifications. Since the 1930s, large areas of marsh surrounding the lake and bordering the Sprague River have been diked, ditched, and drained for agricultural use, leading to the decomposition of organic soils. Riparian vegetation has been degraded or completely eliminated. Regulation of the lake for irrigation purposes has caused lake-stage fluctuations to be both higher and lower than natural levels at different times of the year. Lake flushing patterns have also changed as a result of reservoir regulation and stream diversions. At low levels the lake is more susceptible to wind-induced resuspension of bottom sediment.
On the basis of 3-D modeling of the wind-driven circulation resulting from prevailing wind conditions and the continuous data collected at the water quality network that supported the 2002-04 fish movement and behavior study, it appeared that water highly depleted of dissolved oxygen was transported into the northern area from the southern area of the lake, rather than the conditions having developed locally. It was shown that a fairly persistent clockwise circulation pattern around the lake in response to prevailing wind conditions circulates water around the lake over a time period of several days. Superposition of this circulation onto observed spatial patterns in water quality, particularly dissolved oxygen, has implications for the interactions of hydrodynamics, understanding of the ecology of A. flos-aquae, and possibly forecasting conditions which could lead to fish kill events.
The main objective of this long-term study is to be able to provide an assessment of water quality conditions in the lake on a real-time or nearly real-time basis. The collection of continuous water quality data will provide evidence on how water quality conditions in the lake are changing on long (multiyear to decadal) time scales. In addition, the collection of wind data from multiple meteorological stations around the lake will allow for the development of a spatially accurate wind field to force the 3-D hydrodynamic model. Emphasis has been placed on the collection of wind data because the wind and resulting currents are likely important factors in the development of severe water quality events. Additional meteorological data are collected at stations around the lake (air temperature, solar radiation, relative humidity). These data are used to generate boundary conditions for a 3-D model of heat transport.
The Bureau of Reclamation is responsible for managing Upper Klamath Lake in a way that balances the needs of endangered species, its agricultural contractors, and its Tribal Trust responsibilities. This study assists and improves water management decisions in the Upper Klamath Basin and provides a better physical understanding of the basin hydrology. The ideas for this long-term study are largely the result of discussions held during a workshop in Klamath Falls in December, 2004. The USGS, Bureau of Reclamation, U.S. Fish and Wildlife Service, Oregon Department of Fish and Wildlife, and the Klamath Basin Rangeland Trust participated in the workshop. The water quality data collected from the 2002-04 study in the northern third of the lake were also used to help design the long-term monitoring plan.
According to the USGS report, Strategic Directions for the Water Resources Division, 1998-2008, (http: wwwqvarsa.er.usgs.gov/~gcomfort/Strategic_direction/) the Water Resources Division will, in order to enhance its interpretive and assessment studies, make an effort to "design study products that will be more useful and relevant to solving problems that are faced by water managers and other decisionmakers." The data collected during this project will provide basic information about the lake’s temporally and spatially varying water quality, which will serve water managers over the long term, particularly in support of the goals of the Clean Water and Endangered Species Acts, and advance our understanding of how the lake ecosystem functions.
The long-term monitoring plan is carried out in three distinct efforts: (1) the continuous monitoring network, (2) the continuous collection of weather data at several stations on and around the lake, and (3) the weekly collection of water samples for the analysis of nutrient and chlorophyll a concentration. The project also incorporates short-term water quality measurements and sampling as needs arise.
Continuous Monitoring Network
The monitoring sites were chosen on the basis of the flow paths in the lake instead of, for example, attempting to have each site represent an equal area or volume of the lake. The lake outlet is currently monitored by the Bureau of Reclamation with a continuous water quality monitor at the Link River Dam. YSI model 600XLM, 6920, or 6600 continuous water quality monitors are in place at 13 locations in Upper Klamath Lake and 2 locations in Agency Lake during the field season from May through September (fig. 1, table 1). Five additional, short-term nearshore sites were added in 2006 to monitor water quality of larval sucker habitat (table 2). At all of these locations, a sonde (collection of water quality constituent sensors) is placed 1 m from the lake bottom. When the water depth at the site is less than 2 meters, the sonde is placed midway between the surface and bottom. At four deepwater locations: SET, MDT, EPT, and MDN, a second sonde is placed on the same mooring at a depth of 1 m from the surface for monitoring vertical stratification in the water column. All sondes record dissolved oxygen concentration, pH, specific conductance, and temperature at the beginning of every hour.
Weather Data Collection
Meteorological stations record wind direction and speed, long and short wave radiation, relative humidity, and temperature (see each meteorological site for the respective parameters measured). Because the currents in Upper Klamath Lake are highly responsive to the wind at the water surface, and because the lakewide circulation and a degree of vertical stability in the water column are critical to determining water quality in the lake, it is necessary to have a complete and spatially accurate wind dataset for use in the 3-D hydrodynamic model of the lake. Beginning in 2005, the USGS greatly increased the monitoring of wind on and around the lake, with a total of six meteorological sites, in order to provide redundancy and to capture spatial variability in the wind field. Two floating meteorological sites operate on the lake during the field season only and record the wind over the broad northern and southern expanses of the lake. The four other sites are on land around the northern and western perimeter of the lake near the lake shore and operate throughout the year.
Water Sample Collection
Water samples are collected weekly during the field season from May through September according to established protocols (USGS, variously dated). Samples are analyzed for chlorophyll a, total phosphorus, ammonia (ammonia plus ammonium), orthophosphate, and nitrite-plus-nitrate concentrations. Measurement of chlorophyll a concentrations in the lake is complicated by the fact that A. flos-aquae cells are able to regulate their buoyancy. Therefore, under stable conditions algae can be concentrated in a small layer somewhere in the water column, such that peak concentrations could easily be missed by a point sensor in a fixed location. Water sample collection protocols compensate for this by specifying a depth-integrated water sample. For the time being, therefore, reliable measurements of chlorophyll continue to require the collection of a representative volume of water, rather than collecting continuous data at a point with a chlorophyll sensor. Of the 15 long-term water quality monitoring sites, 6 sites in a field season are selected for these analyses: MDN, WMR, EPT, MDT, RPT (2006 only), HDB, and MDL (2005 only).
The Klamath Tribes have collected water samples on the lake since 1988. The Tribes’ analyses currently include depth-averaged total phosphorus, orthophosphate, total nitrogen, ammonia nitrogen, nitrate/nitrite nitrogen, chlorophyll a, and phaeophytin, as well as instantaneous measurements of dissolved oxygen, pH, temperature, and specific conductance at several points in the water column profile. Secchi depth and the photosynthetically active radiation at several points in the water column also are recorded. Monitoring of significant tributary inputs is important for constructing nutrient mass balances for the lake and to establish boundary conditions on chlorophyll and biological oxygen demand. The Klamath Tribes currently monitor the Williamson River at the Modoc Point Bridge, which provides an acceptable boundary condition to the lake.
Continuous Water Quality Monitor Data, Water Quality Sample Data, and Meteorological Data
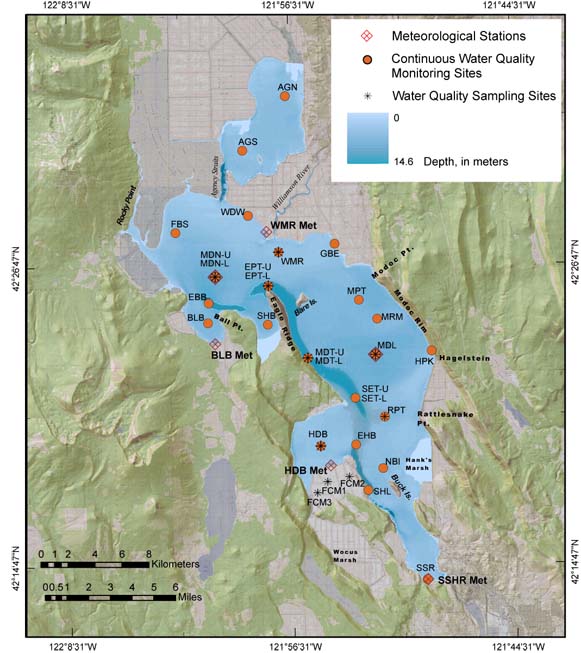
| Figure 1. Upper Klamath and Agency Lake continuous water quality monitoring sites (click on a site to create a customized graph of available data) |
|
Table 1. Upper Klamath and Agency Lake water quality monitoring and sampling sites, 2005 [Click on hyperlinks to access station data; C = continuous water quality record; S = water quality sample data; M = meterological data; NM = no measurement] |
||||
|
Site name and data link
|
Site name abbreviation
|
USGS site ID number
|
Full-pool measured depth (meters)
|
Full-pool measured depth (feet)
|
|
Water quality sample sites
|
||||
| Agency Lake North C | AGN | 423335121564300 | 3 | 9.8 |
| Agency Lake South C | AGS | 423124121583400 | 2.5 | 8.2 |
| Ball Bay C | BLB | 422421122010100 | 3.5 | 11.5 |
| Eagle Point (lower) C,S | EPT-L | 422559121574400 | 12.5 | 41 |
| Eagle Point (upper) C | EPT-U | 422559121574403 | 12.5 | 41 |
| Fish Banks C | FBS | 422809122024400 | 2.8 | 9.2 |
| Entrance to Howard Bay C | EHB | 421935121530600 | 5.2 | 17.1 |
| Howard Bay C,S | HDB | 421933121550000 | 2.5 | 8.2 |
| Middle of the trench (lower) C,S | MDT-L | 422305121553800 | 15 | 49.2 |
| Middle of the trench (upper) C | MDT-U | 422305121553803 | 15 | 49.2 |
| Midlake C,S | MDL | 422312121515900 | 4.5 | 14.8 |
| Midnorth (lower) C,S | MDN-L | 422622122004000 | 4.2 | 13.8 |
| Midnorth (upper) C | MDN-U | 422622122004003 | 4.2 | 13.8 |
| Modoc Point C | MPT | 422543121525100 | 3.7 | 12.1 |
| North Buck Island C | NBI | 421838121513900 | 2.8 | 9.2 |
| Rattlesnake Point C | RPT | 422042121513100 | 3.4 | 11.2 |
| Shoalwater Bay C | SHB | 422420121574300 | 3.3 | 10.8 |
| UKL at Williamson River Outlet C,S | WMR | 422719121571400 | 2.5 | 8.2 |
|
Meteorological sites
|
||||
| Tulana M | WMR Met | 422809121574800 | NM | NM |
| Ball Bay M | BLB Met | 422341122003800 | NM | NM |
| Howard Bay M | HDB Met | 421846121542800 | NM | NM |
| South Shore M | SSHR Met | 421402121491400 | NM | NM |
| Midlake M | MDL Met | 422312121515900 | 4.5 | 14.8 |
| Midnorth M | MDN Met | 422622122004000 | 4.2 | 13.8 |
| Table 2. Upper Klamath and Agency Lake water quality monitoring and sampling sites, 2006
[Click on hyperlinks to access station data; C = continuous water quality record; M = meterological data; NM = no measurement] |
||||
| Site | Site name abbreviation | USGS site ID number | Full-pool measured depth (meters) |
Full-pool measured depth (feet)
|
|
Open-water sites
|
||||
| Agency Lake North C |
AGN
|
423335121564300 |
3
|
9.8
|
| Agency Lake South C |
AGS
|
423124121583400 |
2.5
|
8.2
|
| Fish Banks C |
FBS
|
422808122024400 |
2.8
|
9.2
|
| Eagle Point (lower) C |
EPT-L
|
422559121574400 |
12.5
|
41.0
|
| Eagle Point (upper) C |
EPT-U
|
422559121574403 |
12.5
|
41.0
|
| Entrance to Ball Bay C |
EBB
|
422519122005800 |
7.5
|
24.6
|
| Entrance to Howard Bay C |
EHB
|
421935121530600 |
5.2
|
17.1
|
| Howard Bay C |
HDB
|
421933121550000 |
2.2
|
7.2
|
| Middle of the trench (lower) C |
MDT-L
|
422305121553800 |
15
|
49.2
|
| Middle of the trench (upper) C |
MDT-U
|
422305121553803 |
15
|
49.2
|
| Midnorth (lower) C |
MDN-L
|
422622122004000 |
4.2
|
13.8
|
| Midnorth (upper) C |
MDN-U
|
422622122004003 |
4.2
|
13.8
|
| Modoc Rim C |
MRM
|
422437121515200 |
3.7
|
12.1
|
| North Buck Island C |
NBI
|
421838121513900 |
2.8
|
9.2
|
| Rattlesnake Point C |
RPT
|
422042121513100 |
3.4
|
11.2
|
| South End of Trench (lower) C |
SET-L
|
422128121530600 |
7.0
|
23.0
|
| South End of Trench (upper) C |
SET-U
|
422128121530603 |
7.0
|
23.0
|
| UKL at Williamson River Outlet C |
WMR
|
422719121571400 |
2.5
|
8.2
|
|
Nearshore sites
|
||||
| Goose Bay East C |
GBE
|
422749121540700 |
2.4
|
7.9
|
| Hagelstein Park C |
HPK
|
422319121585700 |
2.6
|
8.5
|
| Skillet Handle C |
SHL
|
421746121522800 |
2.5
|
8.2
|
| Williamson Delta West C |
WDW
|
422842121584300 |
2.2
|
7.0
|
| South Shore C |
SSR
|
421410121492000 |
2.5
|
8.2
|
|
Note: Nearshore site depths were measured on June 14, 2006, and were most likely not depths at full pool.
|
||||
|
Lake Ewauna buoyancy assay sites
|
||||
| Link River |
LRV
|
421311121472100 |
2.6
|
8.7
|
| Fremont Bridge |
FBR
|
421420121481700 |
3.8
|
12.3
|
| Lake Ewauna Trestle |
LET
|
421205121462300 |
3.8
|
12.5
|
|
Note: Lake Ewauna site depths were measured on July 26, 2006, and were most likely not depths at full pool.
|
||||
|
Flooded Caledonia Marsh sampling sites
|
||||
| Flooded Caledonia Marsh site 1 |
FCM-1
|
421807121543800 |
2.5
|
8.2
|
| Flooded Caledonia Marsh site 2 |
FCM-2
|
421819121532800 |
2.1
|
6.9
|
| Flooded Caledonia Marsh site 3 |
FCM-3
|
421740121551200 |
2.6
|
8.7
|
|
Note: Caldonia Marsh site depths were measured on June 28, 2006, and were most likely not depths at full pool.
|
||||
|
Meteorological sites
|
||||
| Tulana M |
WMR Met
|
422809121574800 |
NM
|
NM
|
| Ball Bay M |
BLB Met
|
422341122003800 |
NM
|
NM
|
| Howard Bay M |
HDB Met
|
421846121542800 |
NM
|
NM
|
| South Shore M |
SSHR Met
|
421402121491400 |
NM
|
NM
|
| Midlake M |
MDL Met
|
422312121515900 |
4.5
|
14.8
|
| Midnorth M |
MDN Met
|
422622122004000 |
4.2
|
13.8
|
Note: Data for 2002-04 for select sites are available as part of the study, Movements and Behavior of Radio-Tagged Adult Lost River and Shortnose Suckers in Response to Water Quality in Upper Klamath Lake, Oregon. The continuous monitoring array associated with the adult behavioral study was located primarily in the northern third of Upper Klamath Lake in order to provide a continuous water quality “map” onto which the fish locations obtained from the tracking could be overlaid. The long term project will do a better job of monitoring the whole lake, and doesn’t require the intense spatial resolution of the fish behavioral study.
Chlorophyll Data
The chlorophyll a sampling program, which uses EPA method 445.0 (U.S. Environmental Protection Agency, 1997) for chlorophyll a analysis, was designed to measure this surrogate for algal biomass in a cost-effective way, with good precision, and allow a reliable assessment of relative changes in algal biomass. The results of quality-assurance sampling and other more qualitative assessments of the dataset indicate that the chlorophyll a dataset is well-suited to this purpose. However, the high concentrations of chlorophyll a reported create limitations in applying the results of this method. Values > 250 µg/L are past the upper limit of the linear dynamic range for this method; however these values are highly reflective of the observed bloom conditions and can be considered relative to conditions existing across sites. Exceptionally high values have been measured in
The quality-assurance program includes field blanks (the first sample collected every week) and either a split sample or a method replicate (each type every other week). Field blanks are samples of deionized water processed onsite through clean sampling equipment, before an environmental sample is collected. Analysis of blank samples determines if the processes of collection, handling, transport, and analysis cause measurable contamination.
Samples for the analysis of 2005 chlorophyll a (table 3) were sent to Aquatic Analysts in White Salmon, Washington. Nine replicates were collected (7 percent of the total samples); the median percentage of the differences between the replicates was 7 percent. Five split samples were collected (4 percent of the total); the median difference between the samples was 14 percent. Samples for the analysis of 2006 chlorophyll a (table 4) were sent to
Chlorophyll a was determined fluorometrically for this study. The quantitative comparability between this method and the high performance liquid chromatography method used by the NWQL to determine chlorophyll a in samples prior to October 1, 2005, has not been established, and the chlorophyll a data collected during this study are not stored in the USGS NWIS database. Chlorophyll a data collected by the Klamath Tribes in their biweekly sampling program were analyzed by a spectrophotometric method; therefore the chlorophyll a data collected during this study should not be assumed to be quantitatively comparable to that dataset either.
|
||||||||||||||||||||||||||||||||||||||||||||||||||||||||||||||||||||||||||||||||||||||||||||||||||||||||||||||||||||||||||||||||||||||||||||||||||||||||||||||||
REFERENCES CITED
Aran, E.J., and Collins, G.B.,1997, Method 445.0--In vitro determination of chlorophyll a and pheophytin a in marine and freshwater algae by fluorescence, rev. 1.2: U.S. Environmental Protection Agency, 22 p. [http://www.epa.gov/nerlcwww/m445_0.pdf, last accessed on March 26, 2007]
Eilers, J. M., Kann, J., Cornett, J., Moser, K., and St. Amand, A., 2004, Paleolimnological evidence of change in a shallow, hypereutrophic lake--Upper Klamath Lake, Oregon, USA: Hydrobiologia, v. 520, no. 1-3, p. 7-18.
U.S. Fish and Wildlife Service, 1993, Lost River (Deltistes luxatus) and shortnose (Chasmistes brevirostris) sucker recovery plan: Portland, Oregon.
U.S. Geological Survey, variously dated, National field manual for the collection of water-quality data: U.S. Geological Survey Techniques of Water-Resources Investigations, book 9, chaps. A1-A9 [http://pubs.water.usgs.gov/twri9A, last accessed March 26, 2007]
Wood, T.M., Hoilman, G.R, Lindenberg, M.K., 2006, Water-Quality Conditions in Upper Klamath Lake, Oregon, 2002-04: U.S. Geological Survey Scientific Investigations Report 2006-5209, 52 p. [http://pubs.usgs.gov/sir/2006/5209/, last accessed March 26, 2007]
UPPER KLAMATH LAKE WATER QUALITY REPORTS
OFR 95-285. Selected bibliography of water related research in the Upper Klamath Lake Basin, Oregon, by Dorie L. Brownell and Mia R. Rinallo.
WRIR 96-4079. Relation between selected water-quality variables and lake level in Upper Klamath and Agency Lakes, Oregon, 1996, by Tamara M. Wood, Gregory J. Fuhrer, and Jennifer L. Morace.
WRIR 01-4080. Sediment oxygen demand in Upper Klamath and Agency Lakes, Oregon, 1999, by Tamara M. Wood.
SIR 2006-5209. Water quality conditions in Upper Klamath Lake, Oregon, 2002-04, by Tamara M. Wood, Gene R. Hoilman, and Mary K. Lindenberg.
SIR 2008-5026. Water Quality Conditions in Upper Klamath and Agency Lakes, Oregon, 2005, by Gene R. Hoilman, Mary K. Lindenberg, and Tamara M. Wood.
SIR 2008-5076. Modeling Hydrodynamics and Heat Transport in Upper Klamath Lake, Oregon, and Implications for Water Quality, by Tamara M. Wood, Ralph T. Cheng, Jeffrey W. Gartner, Gene R. Hoilman, Mary K. Lindenberg, and Roy E. Wellman.
SIR 2008-5201. Water Quality Conditions in Upper Klamath and Agency Lakes, Oregon, 2006, by Mary K. Lindenberg, Gene Hoilman, and Tamara M. Wood.
SIR 2009-5025. Water Quality of a Drained Wetland, Caledonia Marsh on Upper Klamath Lake, Oregon, after Flooding in 2006, by Mary K. Lindenberg and Tamara M. Wood.
SIR 2009-5004. Hydrologic and Water-Quality Conditions During Restoration of the Wood River Wetland, Upper Klamath River Basin, Oregon, 2003–05, by Kurt D. Carpenter, Daniel T. Snyder, John H. Duff, Frank J. Triska, Karl K. Lee, Ronald J. Avanzino, and Steven Sobieszczyk.
SIR 2010-5201. Empirical Models of Wind Conditions on Upper Klamath Lake, Oregon, by Norman L. Buccola and Tamara M. Wood.
SIR 2010-5203. Use of Acoustic Backscatter and Vertical Velocity to Estimate Concentration and Dynamics of Suspended Solids in Upper Klamath Lake, South-Central Oregon: Implications for Aphanizomenon flos-aquae, by Tamara M. Wood and Jeffrey W. Gartner.
SIR 2012-5004. Dependence of Flow and Transport through the Williamson River Delta, Upper Klamath Lake, Oregon, on Wind, River Inflow, and Lake Elevation, by Tamara M. Wood.
SIR 2012-5016. Dispersal of Larval Suckers at the Williamson River Delta, Upper Klamath Lake, Oregon, 2006—09, by Tamara M. Wood, U.S. Geological Survey, Heather A. Hendrixson, The Nature Conservancy, Douglas F. Markle, Oregon State University, Charles S. Erdman, The Nature Conservancy, Summer M. Burdick, U.S. Geological Survey, Craig M. Ellsworth, U.S. Geological Survey, and Norman L. Buccola, U.S. Geological Survey.
![]() U.S. Department of the Interior |
U.S. Geological Survey
U.S. Department of the Interior |
U.S. Geological Survey
URL: https://or.water.usgs.gov/projs_dir/klamath_ltmon/index.html
Page Contact Information: Oregon Webteam
Page Last Modified: Tuesday, 20-Dec-2016 16:32:22 EST
