The HYDRA rainfall network is operated and maintained by the City of Portland Bureau of Environmental Services. Rainfall data are provided with their permission and cooperation.
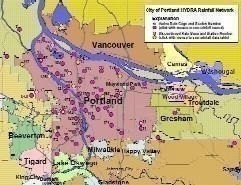
| Location Map
Click on the map below to open a full-screen map with links to each station. |
Rainfall data for these sites are updated hourly. Disclaimer: Rainfall data on this page have not received final approval and as such are provisional and subject to final revision. The data are released on the condition that neither the USGS, the United States Government, nor the City of Portland may be held liable for any damages resulting from their use. More information about the quality of precipitation data is available. A water year is defined as the 12-month period beginning October 1 of any year and continuing through September 30 of the following year. The water year is designated by the calendar year in which it ends and which includes 9 of the 12 months. Thus, the water year ending September 30, 2018 is called the 2018 water year.
|
|||||||||||||||
 |
||||||||||||||||
| City of Portland Rain Gages | ||||||||
|---|---|---|---|---|---|---|---|---|
| Station Name | Sta. No. |
Time of Latest Reading |
Accumulation (inches) | Data | ||||
| 1-day | 3-day | 5-day | Apr | Water Year |
||||
| Portland Area Summary | ||||||||
| Portland area -- average rainfall, 44 gages, not including the Irvington and South Waterfront rain gages, or the Cottrell School rain gage, which is outside of the general Portland area. | 0.01 | 0.26 | 0.87 | 1.51 | 39.24 | |||
| Historical Portland area average rainfall from HYDRA network stations through today's date (at least 25 years of data) | 2.96 | 32.72 | ||||||
| North Region | ||||||||
| North region -- average rainfall, 9 gages. | 0.00 | 0.17 | 0.75 | 1.33 | 40.05 | |||
| Hayden Island Rain Gage 1740 N Jantzen Beach Ctr. |
762 | 28-Apr-2024, 9:27 | 0.00 | 0.15 | 0.54 | 1.17 | 37.78 | data table |
| Shipyard Rain Gage 8900 N Sever Road |
993 | 28-Apr-2024, 9:27 | 0.00 | 0.09 | 0.61 | 1.15 | 43.07 | data table |
| Columbia IPS Rain Gage 5001 N Columbia Blvd. |
773 | 28-Apr-2024, 9:27 | 0.00 | 0.07 | 0.73 | 1.35 | 44.21 | data table |
| Albina Rain Gage 2920 N Larrabee Ave. |
776 | 28-Apr-2024, 9:27 | 0.00 | 0.31 | 0.95 | 1.62 | 35.38 | data table |
| Simmons Rain Gage 16001 N Simmons Rd. |
1161 | 28-Apr-2024, 9:27 | 0.00 | 0.19 | 0.72 | 1.23 | 41.21 | data table |
| Cascade PCC Rain Gage 705 N Killingsworth St. |
787 | 28-Apr-2024, 9:27 | 0.00 | 0.22 | 0.89 | 1.54 | 41.18 | data table |
| WPCL Rain Gage 6543 N Burlington Ave. |
786 | 28-Apr-2024, 9:27 | 0.01 | 0.17 | 0.74 | 1.38 | 42.38 | data table |
| Astor Elementary School Rain Gage 5601 N Yale St. |
798 | 28-Apr-2024, 9:27 | 0.00 | 0.10 | 0.65 | 1.16 | 39.16 | data table |
| Swan Island Rain Gage |
1165 | 28-Apr-2024, 9:27 | 0.00 | 0.23 | 0.94 | 1.38 | 36.06 | data table |
| North West Region | ||||||||
| Northwest region -- average rainfall, 5 gages. | 0.00 | 0.34 | 0.97 | 1.66 | 41.96 | |||
| Skyline School Rain Gage 11536 NW Skyline Blvd. |
758 | 28-Apr-2024, 9:27 | 0.01 | 0.18 | 0.77 | 1.68 | 41.04 | data table |
| Sauvie Island School Rain Gage 14445 NW Charlton Rd. |
759 | 28-Apr-2024, 9:27 | 0.00 | 0.23 | 0.90 | 1.67 | 44.77 | data table |
| Yeon Rain Gage 3395 NW Yeon St. |
778 | 28-Apr-2024, 9:27 | 0.00 | 0.34 | 1.09 | 1.72 | 45.12 | data table |
| Metro Learning Center Rain Gage 2033 NW Glisan St. |
793 | 28-Apr-2024, 9:27 | 0.00 | 0.49 | 1.18 | 1.85 | 43.02 | data table |
| Bonny Slope BSD Rain Gage 11775 NW McDaniel Rd. |
1207 | 28-Apr-2024, 9:27 | 0.01 | 0.47 | 0.92 | 1.38 | 35.87 | data table |
| North East Region | ||||||||
| Northeast region -- average rainfall, 9 gages, not including the Irvington rain gage. | 0.00 | 0.25 | 0.90 | 1.61 | 38.72 | |||
| Fernwood School Rain Gage 3255 NE Hancock St. |
764 | 28-Apr-2024, 9:27 | 0.00 | 0.31 | 1.03 | 1.73 | 39.49 | data table |
| Vernon School Rain Gage 2044 NE Killingsworth St. |
768 | 28-Apr-2024, 9:27 | 0.01 | 0.28 | 0.91 | 1.46 | 39.68 | data table |
| Airport Way #2 Rain Gage 14614 NE Airport Way |
774 | 28-Apr-2024, 9:27 | 0.00 | 0.19 | 0.91 | 1.61 | 38.44 | data table |
| Mallory Rain Gage 8030 NE Mallory Ave. |
775 | 28-Apr-2024, 9:27 | 0.00 | 0.12 | 0.67 | 1.22 | 40.16 | data table |
| Beaumont School Rain Gage 4043 NE Fremont Ave. |
783 | 28-Apr-2024, 9:27 | 0.00 | 0.25 | 0.91 | 1.62 | 40.29 | data table |
| Post Office Rain Gage 7660 NE Airport Way |
785 | 28-Apr-2024, 9:27 | 0.00 | 0.22 | 0.86 | 1.56 | 37.48 | data table |
| Leodis V. McDaniel Rain Gage 2735 NE 82nd Ave. |
1190 | 28-Apr-2024, 9:27 | 0.01 | 0.40 | 1.08 | 2.02 | 38.11 | data table |
| Forty-Second Avenue Rain Gage NE 42nd Ave and Buffalo St. |
1198 | 28-Apr-2024, 9:27 | 0.01 | 0.18 | 0.75 | 1.33 | 40.27 | data table |
| Irvington Elementary School Rain Gage 1320 NE Brazee St. |
1204 | 28-Apr-2024, 9:27 | 0.00 | 0.31 | 1.06 | 1.81 | 38.33 | data table |
| Parkrose High School Rain Gage 12003 NE Shaver St. |
1212 | 28-Apr-2024, 9:27 | 0.00 | 0.31 | 0.97 | 1.91 | 34.55 | data table |
| South West Region | ||||||||
| Southwest region -- average rainfall, 10 gages, not including the South Waterfront rain gage. | 0.01 | 0.24 | 0.82 | 1.35 | 38.02 | |||
| Portland Fire Bureau Rain Gage 55 SW Ash St. |
757 | 28-Apr-2024, 9:27 | 0.01 | 0.67 | 1.34 | 2.09 | 42.27 | data table |
| Sylvania PCC Rain Gage SS Bldg, 12000 SW 49th Ave. |
760 | 28-Apr-2024, 9:27 | 0.01 | 0.20 | 0.75 | 1.22 | 33.04 | data table |
| Collins View Rain Gage (Riverdale High School) 9806 SW Boones Ferry Rd. |
763 | 28-Apr-2024, 9:27 | 0.01 | 0.27 | 1.02 | 1.55 | 39.31 | data table |
| Sylvan School Rain Gage 1849 SW 58th Ave. |
788 | 28-Apr-2024, 9:27 | 0.00 | 0.03 | 0.03 | 0.29 | 31.16 | data table |
| Eco Roof Rain Gage SW 12th and Clay |
789 | 28-Apr-2024, 9:27 | 0.01 | 0.31 | 0.93 | 1.47 | 39.34 | data table |
| Maplewood Elementary School Rain Gage 7452 SW 52nd Ave. |
792 | 28-Apr-2024, 9:27 | 0.02 | 0.18 | 0.66 | 1.24 | 35.18 | data table |
| OPB Rain Gage 6932 SW Macadam Ave. |
1191 | 28-Apr-2024, 9:27 | 0.00 | 0.14 | 0.88 | 1.46 | 41.35 | data table |
| Ida B. Wells-Barnett High School Rain Gage 1151 SW Vermont St. |
1203 | 28-Apr-2024, 9:27 | 0.01 | 0.18 | 0.86 | 1.40 | 37.13 | data table |
| Fire Station 18 Rain Gage 8720 SW 30th Ave. |
1211 | 28-Apr-2024, 9:27 | 0.02 | 0.23 | 0.88 | 1.55 | 40.57 | data table |
| OHSU Marquam Hill Rain Gage 3310 SW U.S. Veterans Hospital Rd. |
1221 | 28-Apr-2024, 9:27 | 0.01 | 0.17 | 0.82 | 1.28 | 40.87 | data table |
| OHSU South Waterfront Rain Gage 3930 S Macadam Ave. |
1222 | 28-Apr-2024, 9:27 | 0.00 | 0.13 | 0.78 | 1.36 | 33.83 | data table |
| South East Region | ||||||||
| Southeast region -- average rainfall, 11 gages. | 0.02 | 0.33 | 0.93 | 1.64 | 38.89 | |||
| Mt. Tabor Maintenance Yard Rain Gage 6437 SE Division St. |
761 | 28-Apr-2024, 9:27 | 0.01 | 0.25 | 0.87 | 1.59 | 39.33 | data table |
| Kelly School Rain Gage 9030 SE Cooper St. |
765 | 28-Apr-2024, 9:27 | 0.00 | 0.08 | 0.67 | 1.32 | 37.99 | data table |
| Gresham Fire Dept. Rain Gage 1333 NW Eastman Pkwy. |
766 | 28-Apr-2024, 9:27 | 0.09 | 0.93 | 1.53 | 2.66 | 41.52 | data table |
| Harney Rain Gage 2033 SE Harney St. |
771 | 28-Apr-2024, 9:27 | 0.00 | 0.18 | 0.74 | 1.18 | 39.84 | data table |
| Pleasant Valley School Rain Gage 17625 SE Foster Rd. |
781 | 28-Apr-2024, 9:27 | 0.12 | 0.38 | 1.00 | 2.03 | 42.79 | data table |
| Sunnyside School Rain Gage 3421 SE Salmon St. |
791 | 28-Apr-2024, 9:27 | 0.01 | 0.44 | 1.07 | 1.85 | 39.22 | data table |
| Arleta School Rain Gage 5109 SE 66th Ave. |
794 | 28-Apr-2024, 9:27 | 0.00 | 0.11 | 0.64 | 1.26 | 36.13 | data table |
| Glencoe School Rain Gage 825 SE 51st Ave. |
795 | 28-Apr-2024, 9:27 | 0.02 | 0.56 | 1.18 | 1.98 | 38.19 | data table |
| Multnomah Rain Gage 501 SE Hawthorne Blvd. |
796 | 28-Apr-2024, 9:27 | 0.00 | 0.17 | 0.82 | 1.23 | 38.10 | data table |
| Park SE Yard Rain Gage 5669 SE 136th Ave. |
1194 | 28-Apr-2024, 9:27 | 0.00 | 0.39 | 0.98 | 1.80 | 40.20 | data table |
| Cleveland High School Rain Gage 3400 SE 26th Ave. |
1205 | 28-Apr-2024, 9:27 | 0.00 | 0.10 | 0.69 | 1.18 | 34.52 | data table |
| Other | ||||||||
| Cottrell School Rain Gage 36225 SE Proctor Rd., Boring |
782 | 28-Apr-2024, 9:27 | 0.04 | 0.40 | 0.90 | 2.24 | 45.78 | data table |
| Retired Stations | ||||||||
| Open Meadows School Rain Gage 7602 N Emerald Ave. |
48 | Station was retired on 1-Jul-2019. | data table | |||||
| Swan Island Rain Gage 122 2600 N Going St. |
122 | Station was retired on 27-Sep-2007. | data table | |||||
| Marine Drive Rain Gage 7305 N Marine Dr. |
137 | Station was retired on 13-Jan-2010. | data table | |||||
| Terminal 4 NE Rain Gage 11040 N Lombard St. |
167 | Station was retired on 25-Aug-2011. | data table | |||||
| Bonny Slope School Rain Gage 10351 NW Thompson Rd. |
58 | Station was retired. Data through 08-Mar-2017. | data table | |||||
| Guilds Lake Rain Gage 7110 NW Front Ave. |
125 | Station was retired on 23-Mar-2005. | data table | |||||
| Skyline Fire Station Rain Gage 8031 NW Skyline Blvd. |
147 | Station was retired on 02-Nov-2003. | data table | |||||
| PDX East Business Park Rain Gage 8599 NE Alderwood Rd. |
9 | Station was retired on 21-Sep-2004. | data table | |||||
| Fremont Rain Gage 2777 NE Fremont Dr. |
72 | Station was retired on 12-Aug-2010. | data table | |||||
| Grant Park Rain Gage 1907 NE 45th Ave. |
162 | Station was retired on 20-Oct-2004. | data table | |||||
| Walmart Eco Roof Rain Gage 1123 N Hayden Meadows Dr. |
220 | Station was retired on 22-Mar-2023. | data table | |||||
| Vermont Hills Rain Gage 5730 SW Idaho St. |
89 | Station was retired on 23-Jul-2002. | data table | |||||
| Thomas Rain Gage 4026 SW Macadam Ave. |
120 | Station was retired on 23-Jul-2009. | data table | |||||
| Children's Museum Rain Gage 4015 SW Canyon Rd. |
192 | Station was retired on 25-Aug-2021. | data table | |||||
| Holgate Rain Gage 4507 SE 136th Ave. |
21 | Station was retired on 16-Feb-2012. | data table | |||||
![]() U.S. Department of the Interior |
U.S. Geological Survey
U.S. Department of the Interior |
U.S. Geological Survey
URL: https://or.water.usgs.gov/non-usgs/bes/index.html
Page Contact Information: Stewart Rounds
Page Last Modified: Sunday - Jan 28, 2024 at 11:25:14 EST
